Self-service Performance Debugging
If your site feels slow, here are some things you can do on your end to test that.
Use realistic performance tests
Arc is heavily reliant on caching to improve performance. The slowest paths through the system will incur multiple I/O-related penalties as intra-system traffic is routed between various microservices. This includes (but is not limited to) any upstream traffic from the gateway to the Engine Lambda, all intra-Engine requests (resolver lookups, cache-reads, content-source requests, cache-writes, DynamoDB-read/write), and any downstream traffic that occurs within the content sources. This is not to mention any potential infrastructure-related issues, such as Lambda cold-starts that are naturally slower than requests that reuse Lambda containers.
Tools like TTFB can send multiple requests in rapid succession to ensure sampling includes cached requests.
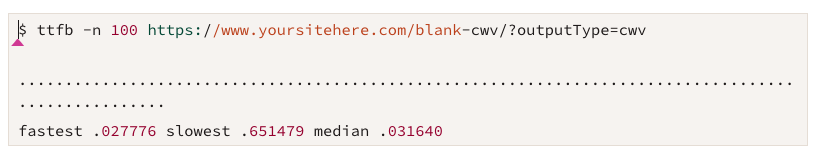 |
In this example, after sending 100 requests to the endpoint in rapid succession, the slowest response takes 651 milliseconds but the median response only takes 31 milliseconds. Although more robust testing could be done—and better tools could be provided—this does show that this page is not performing as poorly as the customer believes.
Alternatively, even sending multiple requests from the browser in quick succession can be enough to force Arc to return a cached response:
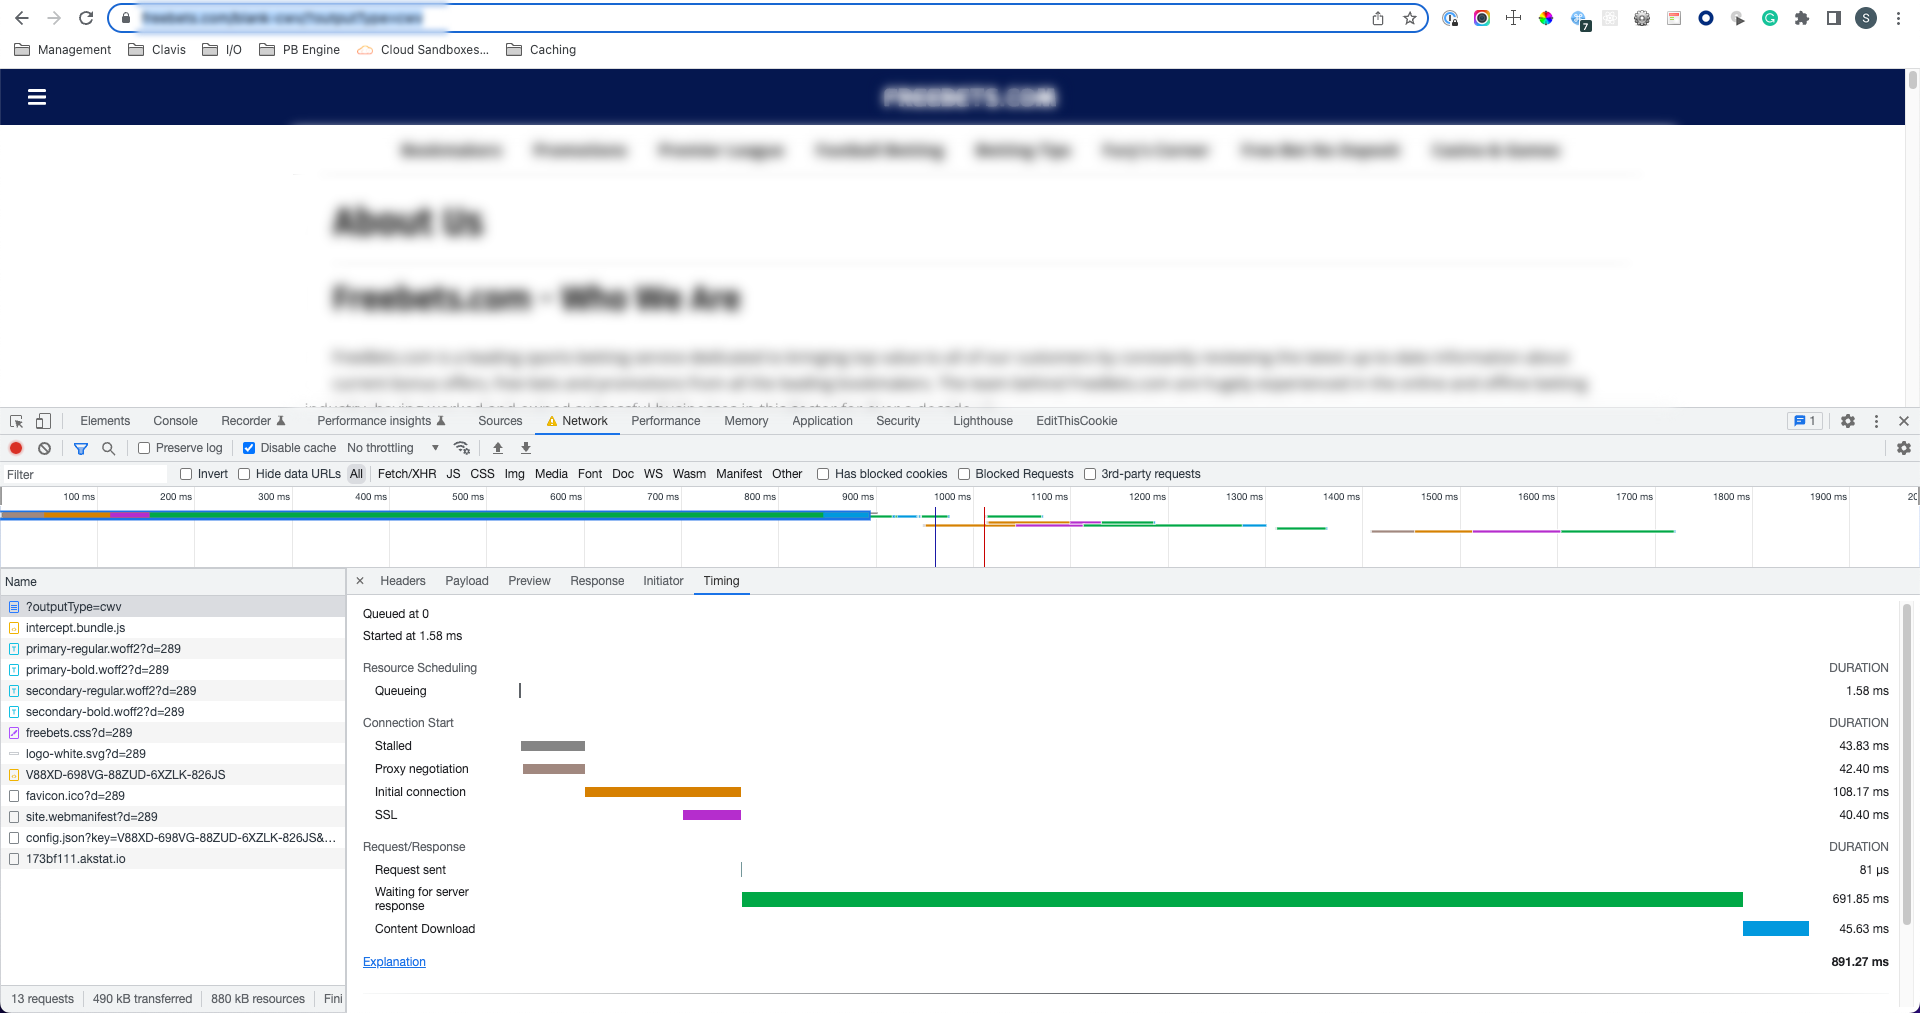 |
A slow response without caching (691ms TTFB)
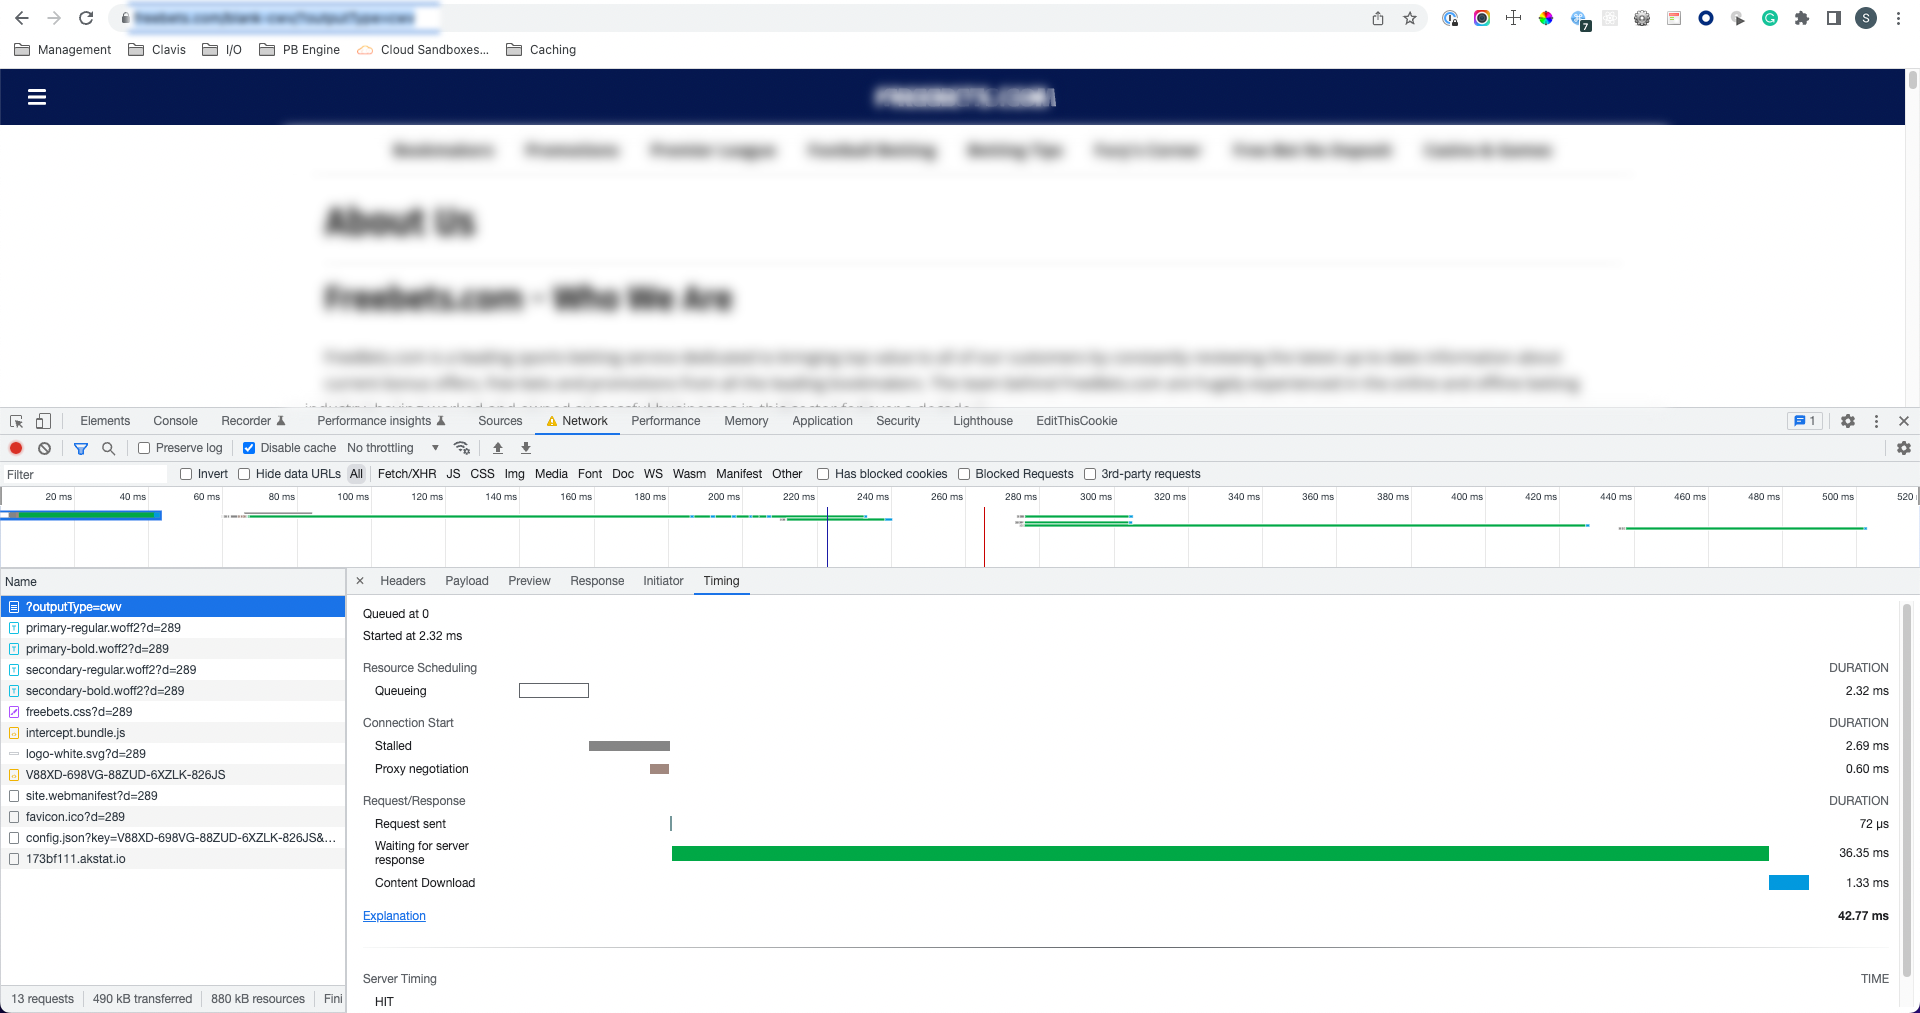 |
A fast response immediately after (36ms TTFB)
Using engine logs to pull response time statistics
Clients who enabled log forwarding and receiving engine logs can run analyses on the Lambda execution log lines to analyze engine render performance percentile buckets, create dashboards with this analysis, and continually monitor engine render performance. In the rest of this document, we will provide information on how to do such analysis using AWS CloudWatch.
Note
Clients configure where and how their logs are stored and the tooling for analyzing logs. The principals of the analysis below should apply to different analysis tools in different query languages.
Using CloudWatch Insights to pull response time statistics
Any customer configured their log forwarding on to AWS CloudWatch’s Log Insights, can use CloudWatch for their fusion-engine-* Lambda should be able to retrieve runtime statistics for their Lambda. Filtering for @type = ‘REPORT’ limits analysis to only the messages that are returned when a Lambda function returns. The @duration field exposes the Lambda’s runtime in milliseconds. From this information, useful statistics about Lambda runtimes may be retrieved.
filter @type = "REPORT"
| fields @duration
| stats
    min(@duration) as `min ms`,
    max (@duration) as `max ms`,
    avg (@duration) as `avg ms`,
    stddev (@duration) as `stdev ms`,
    pct (@duration, 50) as `50pct ms`,
    pct (@duration, 90) as `90pct ms`,
    pct (@duration, 95) as `95pct ms`,
    pct (@duration, 99) as `99pct ms`
This CloudWatch query retrieves the minimum, maximum, mean, standard deviation, median, 90th percentile, 95th percentile, and 99th percentile response times in milliseconds.
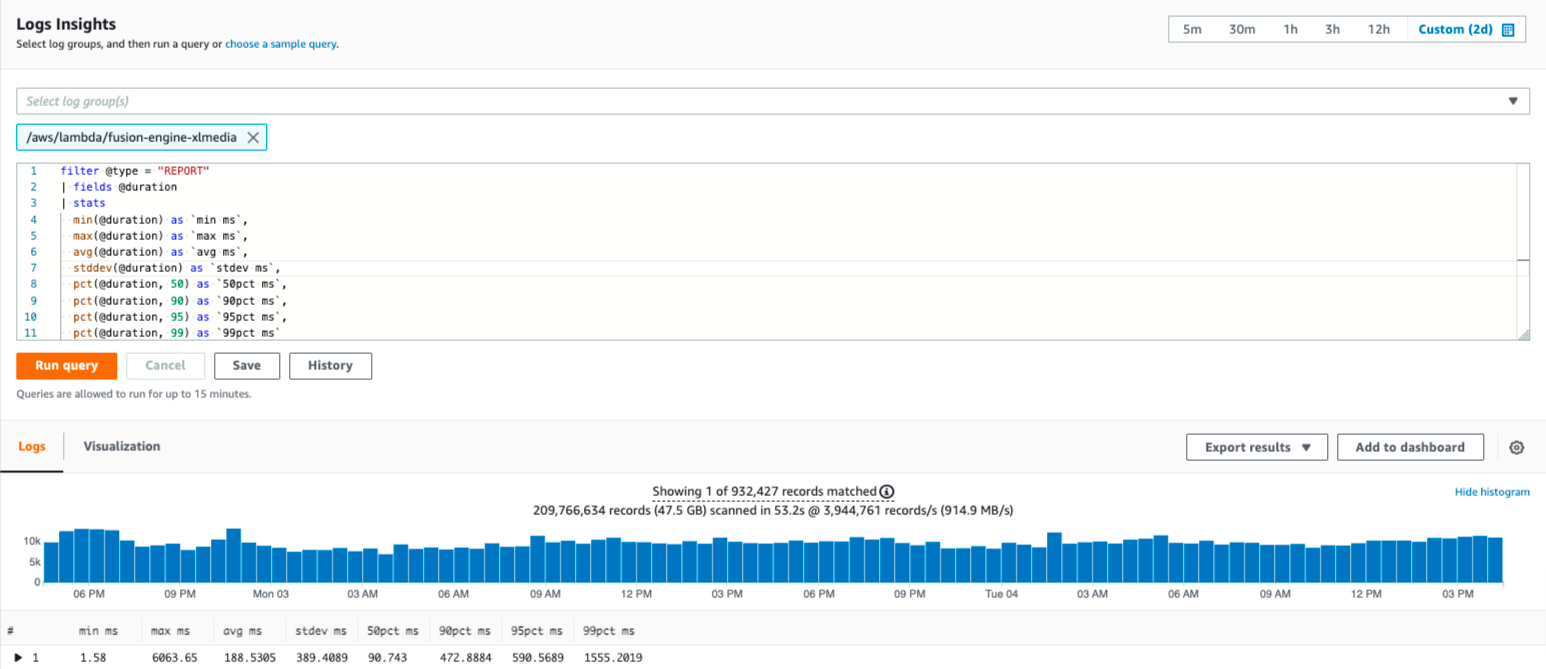 |
These statistics indicate that the Lambda is generally healthy.
In this example, the minimum response time is below 20ms, which indicates that the Lambda is not stalling. The median response time (50pct ms) is below 100ms, indicating that most responses resolve quickly. It is unlikely that Fusion Engine is causing slow response times.
Use CloudWatch to generate a response-time histogram
Any customer with access to AWS CloudWatch’s Log Insights for their fusion-engine-* Lambda should be able to retrieve runtime statistics for their Lambda. Filtering for @type = ‘REPORT’ limits analysis to only the messages that are returned when a Lambda function returns. The @duration field exposes the Lambda’s run-time in milliseconds. From this information, a graph can be generated to show how long most Engine Lambda requests are taking.
filter @type = "REPORT"
    | fields ceil(@duration/100)*100 as bucket
    | stats count (*) by bucket
    | sort bucket
This CloudWatch query creates a histogram of response times in 100ms buckets (rounded up, so that 101ms is counted in the 200ms bucket).
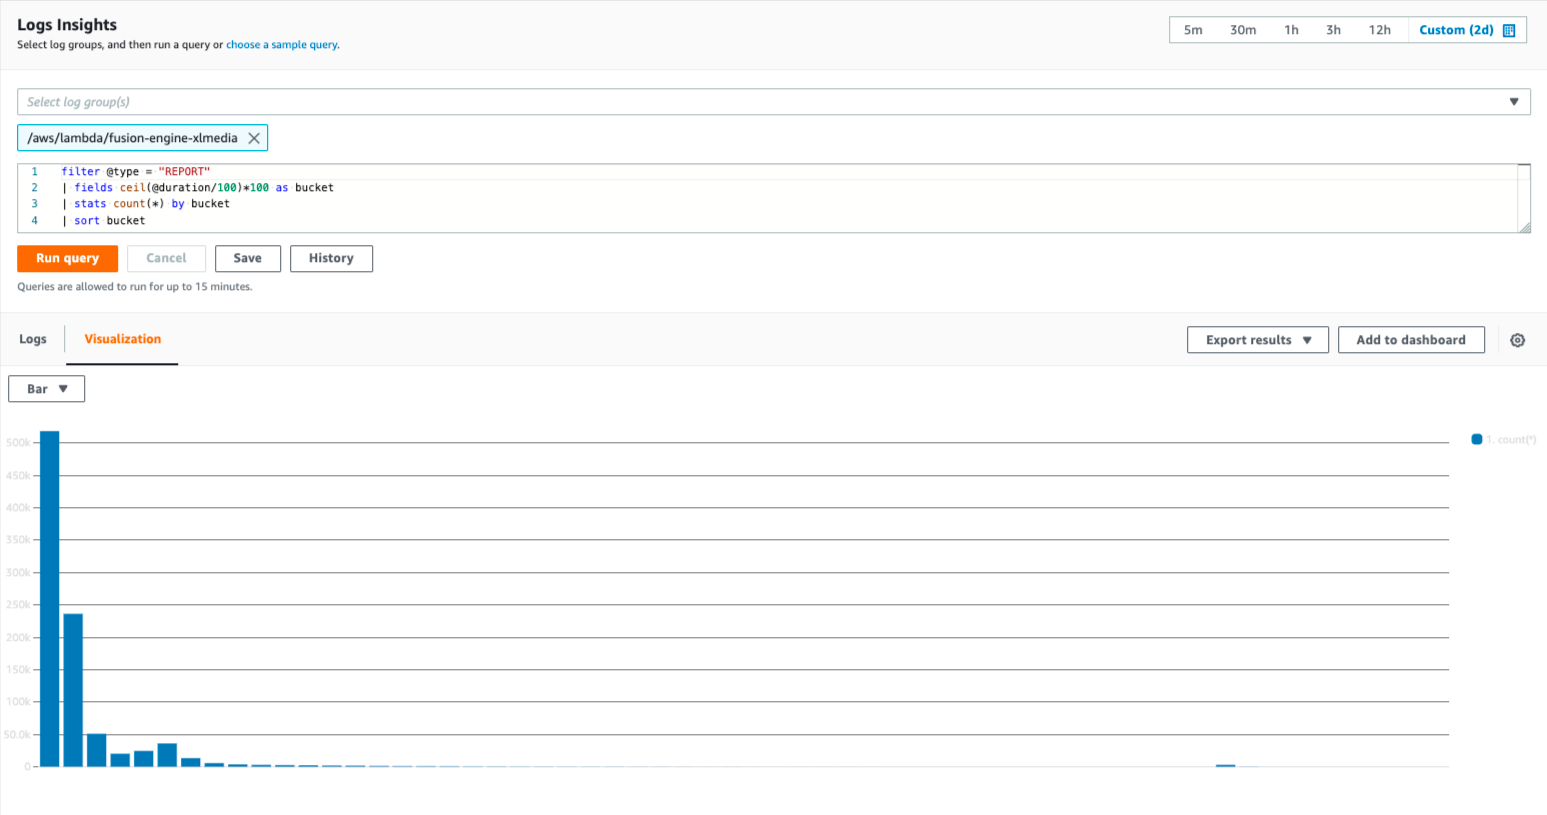 |
Histogram of response times over a 48-hour period, with 100ms buckets (rounded up).
This histogram shows that the Engine Lambda serves the vast majority of requests in under 300ms. It is unlikely that the Engine is causing slow response times.