PageBuilder Editor: Integrated Contextual Analytics
Curate content better
 |
PageBuilder Editor’s Integrated Contextual Analytics feature unifies the analytics and curation experience so editors can easily turn insights into action. Users can see key web metrics for a page within the context of PageBuilder Editor, empowering them to catch emerging trends, explore user journeys, and move insights into action in one, frictionless experience.
At this time, we are excited to support Google Analytics (GA4) and Chartbeat content analytics, and several out-of-the-box metrics for each. This document guides you through the basics of Integrated Contextual Analytics and how it works within PageBuilder Editor.
Note
To successfully use PageBuilder Editor Integrated Analytics, users must:
Set up their analytics integrations in Global Settings under the Analytics tab.
Have the View Analytics permissions, found in Permissions under PageBuilder Editor.
For more information on setup, see Configuring Google Analytics or Configuring Chartbeat content analytics.
Analyze Workspace in PageBuilder Editor
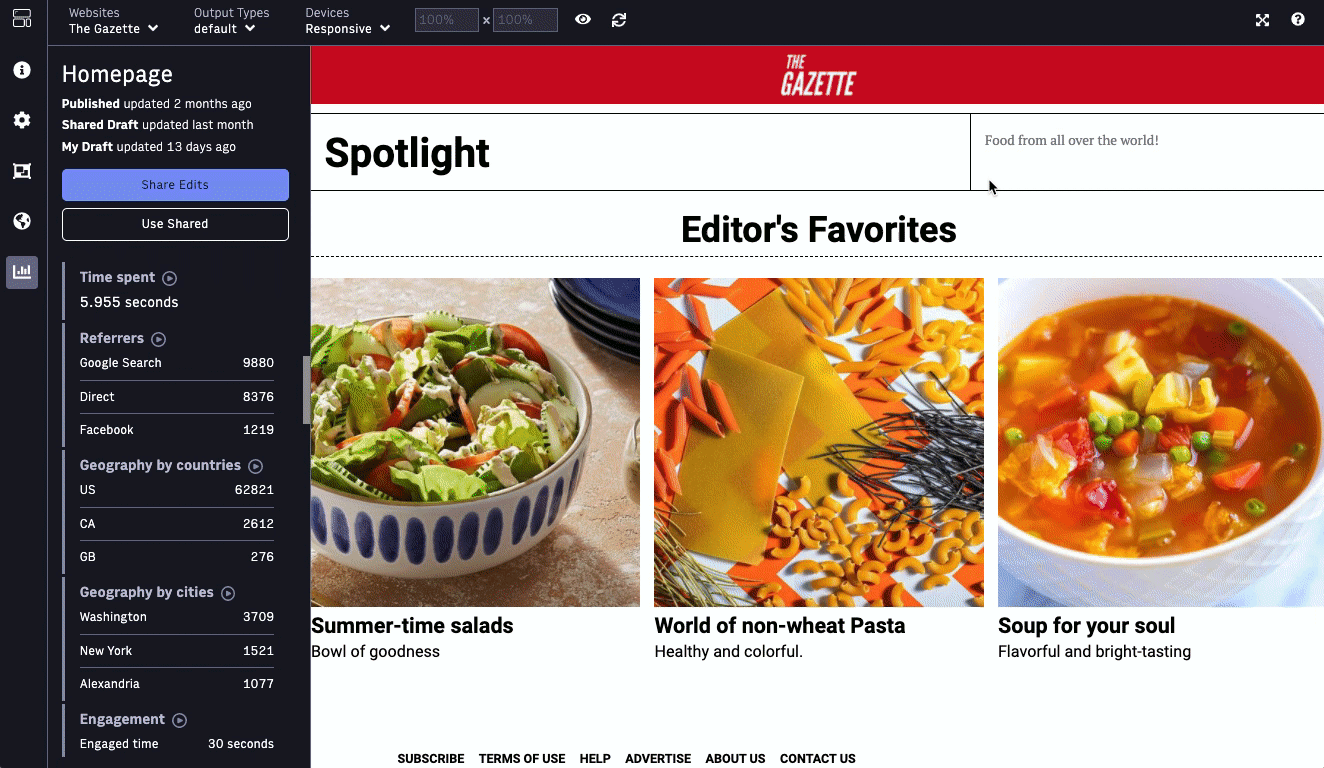
When you open a page in PageBuilder Editor, you will see a new icon on the Workspace bar directly under Publish. This is the Analyze Workspace.
 |
Upon opening the Analyze workspace, a call is made to the analytics provider to fetch the data and is then displayed in a data tile. It may take several seconds for the data tile to update when you first open the Analyze workspace.
Data Tiles and supported metrics
Data tiles display data for supported metrics in a standard format within PageBuilder Editor’s Analyze workspace. Each provider supports a variety of key audience metrics that can help you measure webpage traffic, user engagement and overall learn more about users who interact with your website.
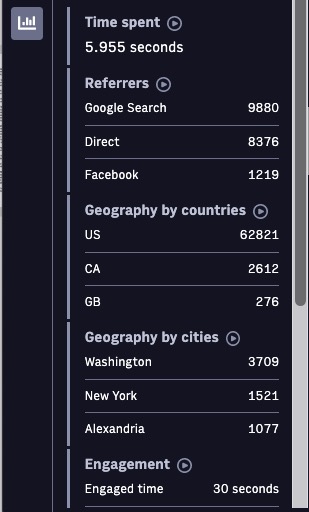 |
Integrated contextual analytics supports several out-of-the-box metrics for Chartbeat content analytics and Google Analytics (GA4) integrations. As part of this experience, we are excited to introduce Data Tiles which display data for the supported metrics in a standard format within PageBuilder Editor’s Analyze workspace.
Each provider supports a variety of key audience metrics that can help you measure webpage traffic, user engagement and overall learn more about users who interact with your website.
Chartbeat analytics supported metrics
For Chartbeat analytics, integrated analytics experience supports several out-of-the-box, real-time metrics. Real-time metrics are updated every 15 seconds and detail what’s happening on your webpage at that moment.
Charbeat Data Tiles | Data tiles description |
|---|---|
Time spent | Returns the number of seconds visitors have spent on the page. |
Referrers | Returns the top three referrers or sources of traffic to your page. Referrers can be: - Internal: visitors who arrived to the page through another page on your site. - Direct: visitors who arrived directly to your page by typing in the URL or using a bookmark. - Link: visitors who arrived directly through an external link, like blogs or other websites that are directing traffic to your platform. - Search: visitors who arrived directly through search engines such as Google, Bing, or Yahoo. - Social: visitors who arrived directly through social platforms such as Facebook, Twitter, Pinterest, or Reddit. |
Geography by country | Returns the top three countries visitors to your webpage originated from. |
Geography by city | Returns the top three cities visitors to your webpage originated from. |
Engage time | Returns the average number of seconds visitors actively engage with each page on your site by scrolling, clicking, typing, etc. |
Engaged visits | Returns the number of active visitors who are interacting with your content. Events contributing to a session being counted as an engaged visit include scrolls, clicks, mouse movements, touch events, and keystrokes. |
To learn more about Chartbeat’s Real-Time API and engagement tracking methodology, see Chartbeat’s API Documentation and User Engagement Tracking Methodology Page.
Google Analytics supported metrics
For Google Analytics (GA4), the integrated analytics experience supports several out-of-the-box, historical metrics. Metrics reported in the data tile are for the past 24 hours and updated at 12:00 AM.
Note
These metrics are for the Google Analytics 4 (GA4). To learn more about GA4 properties, see this Documentation From Google.
Google Analytics data tile | Data tile description |
|---|---|
Page view | Returns the number of webpage views over the last 24 hours. |
Engagement rate | Returns the percentage of engaged sessions over the past 24 hours. This number is calculated by taking the number of sessions that have lasted longer than 10 seconds, had a conversion event, or had 2 or more screen views divided by the number |
Device category | Returns the top 3 device types visitors to your page have used in terms of page views in the last 24 hours. |
Percent page scrolled | This metric returns the number of users who have scrolled a certain percentage of the page in the past 24 hours. Percentages include 10%, 25%, 50%, 75%, 90%, and 100%. Note: To access this metric, your organization must set up a scroll_depth custom dimension. See the How to set up Google Analytics percent scrolled dimension documentation for more details. |
Note
It will take at least 24 hours after the Google Analytics Integration has been setup in Global Settings to return values in the PageBuilder Editor Analyze Workspace.
Local development for integrated contextual analytics
This functionality also supports local development experience. While you can see the Analyze Workspace within PageBuilder Editor, if the configurations have not been set up and the webpage is not a public, published page, valid analytics data will not be returned.
You can update your CLI by running npm install @arc-fusion/cli@latest
Q&A
Q: What privileges do I need to view analytics in PageBuilder Editor?
A: To access the Analytics workspace and view analytics, users will need the View Analytics privilege, located under the PageBuilder Editor tab in the Permissions application.
Q: Does PageBuilder’s integrated analytics feature work on multi-site pages?
A: The integrated analytics feature is available on your multi-site pages as long as all websites for the page have been configured in Global Settings. To view data for a different page, simply navigate to the website dropdown in the charm bar and select a site. This will then make a new call to the API, and data tiles will be updated to reflect the metrics for the page for the specific website.
Note
It may take several seconds for the data tile to update.
Q: How can I test this functionality in Sandbox or other non-production environments?
A: To test in a sandbox or another non-production environment, you must set up your sandbox domain with your analytics provider. However, testing in a sandbox may be problematic since traffic to your sites is likely very low.