Diagnosing Delays in Kinesis Events
Description of the problem
When content is created, updated or deleted in Arc XP, events are generated. Customers who want to integrate Arc XP with external systems can request access to those events through Kinesis Streams.
The typical use case of Kinesis Streams is to synchronize content with another platform and/or to send event notifications. As a result, it is often essential to process those events in a timely manner.
When consuming events, you may, at times, run into situations when it appears events are late. For a publish event, for example, this could show up as the event being processed several minutes after it actually happened.
This article's goal is to help you diagnose and mitigate this issue and implement monitoring to better detect it in the future.
Note
Kinesis processing is a technical topic, and the diagnostic of Kinesis issues requires some level of technical expertise. The intended reader of this article is a developer, with at least some familiarity with the subject matter.
Understanding the Kinesis Setup
Before we dive deeper, let’s first look at the way events flow through the system:
Events are created within Arc XP’s AWS account, then copied to the stream as messages
Messages (containing events) are consumed within the customer’s AWS account, then processed
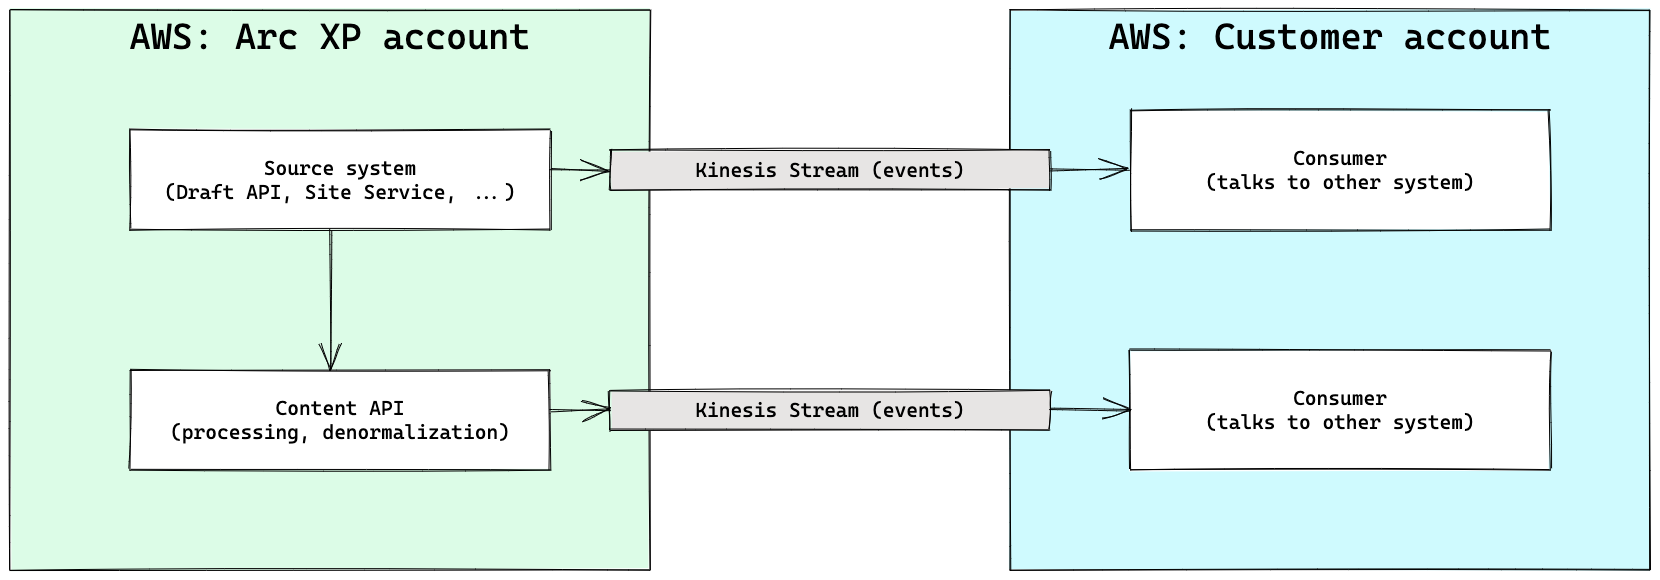 |
Where can delays happen?
Looking at the schema above, delays can really happen in two places:
Arc XP is late sending the messages
The customer is late consuming the messages
Based on experience, in the vast majority of cases, the delay occurs on the customer side. For instance, Arc XP is sending the message as expected, on time, but there is a delay on the consumer side. We’ll explore further down possible causes for delay, but let’s first see how we can verify where the delay is occurring.
Verifying the location of the delay
Accessing messages in a Kinesis Stream using simple command line tools is not entirely straightforward. As a result, we provide a script below that will take care of the boilerplate, and report directly the difference between the time the message was added to the stream, and the time of the event. The output looks like this:
1QJPJHOBTP5FEDPJAHR5BVJWU7Y / 2022-07-09T22:03:58.986+00:00 / insert-story / 380ms behind
2QJPJHOBTP5FEDPJAHR5BVJWU7Y / 2022-07-09T22:05:07.077+00:00 / insert-story / 393ms behind
374BTXJPIDVFYHEJBMLAJEFSMJM / 2022-07-09T22:05:07.423+00:00 / insert-story / 299ms behind
474BTXJPIDVFYHEJBMLAJEFSMJM / 2022-07-09T22:05:07.730+00:00 / insert-story / 317ms behind
574BTXJPIDVFYHEJBMLAJEFSMJM / 2022-07-09T22:05:08.229+00:00 / insert-story / 477ms behind
6QJPJHOBTP5FEDPJAHR5BVJWU7Y / 2022-07-09T22:05:29.032+00:00 / insert-story / 324ms behind
7YUPPEL3AIFFHPM4BHHZBH75BWQ / 2022-07-09T22:05:39.005+00:00 / insert-story / 266ms behind
8YUPPEL3AIFFHPM4BHHZBH75BWQ / 2022-07-09T22:05:39.210+00:00 / insert-story / 205ms behind
9YUPPEL3AIFFHPM4BHHZBH75BWQ / 2022-07-09T22:05:39.805+00:00 / insert-story / 498ms behind
10...
In this case, we see that all messages appeared on the stream within 500ms of the event occurring.
Script prerequisites
The script requires:
An installation of the AWS CLI (see documentation)
A recent installation of NodeJS (14.x, 16.x, …)
It uses Google ZX which is a simple utility that enables you to write scripts using NodeJS.
A difference between Mac and Linux
The content of messages is, in part, encoded using base64. Both Mac and Linux provide utilities to decode base64, but they differ slightly in their syntax and use. In the script below, we use the Linux syntax:
base64 -d
If you run the script on a Mac, change this (line 37) to use:
base64 -D
Script
Copy the content below into a new file index.js, and then modify the first two lines to update the Stream name and the start time. Because events come and go, if you are trying to debug an issue currently occurring, you might want to set the start time to a couple hours ago (or, depending on volume, a couple minutes ago).
// Configure stream
const STREAM = `com.arcpublishing.<ORG>.contentv2.ans.v3`;
const START_TIME = `2022-07-01T00:00:00.000+0o:00`;

(async () => {
  // Get shard IDs
  let result = await $`aws kinesis describe-stream --stream-name ${STREAM}`;
  result = JSON.parse(result);
  let shardIds = result.StreamDescription.Shards.map((s) => s.ShardId);

  // Get iterators
  const iterators = [];
  for (let shard of shardIds) {
    let iterator = await $`aws kinesis get-shard-iterator \
      --stream-name ${STREAM} \
      --shard-id ${shard} \
      --shard-iterator-type AT_TIMESTAMP \
      --timestamp ${START_TIME} \
      --output text`;
    iterators.push({
      shard: shard,
      iterator: iterator.stdout.trim(),
    });
  }

  // Turn off verbose output
  $.verbose = false;

  // Read the stream
  iterators.map(async (iterator) => {
    while (iterator.iterator) {
      let result = await $`aws kinesis get-records --shard-iterator ${iterator.iterator}`;
      result = JSON.parse(result.stdout);

      for (let record of result.Records) {
        try {
          record.Data = (await $`echo ${record.Data} | base64 -d | gunzip`).stdout;

          // Some records are too large, and so are stored as a URL instead.
          // For those, we need to fetch the signed S3 URL to get the payload.
          try {
            record.Data = JSON.parse(record.Data);
          } catch (err) {
            record.Data = await $`curl ${record.Data} | gunzip`;
            record.Data = JSON.parse(record.Data.stdout);
          }

          let date1 = new Date(record.ApproximateArrivalTimestamp);
          let date2 = new Date(record.Data.body && record.Data.body.last_updated_date);
          let diff = date1 - date2;

          // Log the time difference
          let name = `${record.Data.id} / ${record.Data.date} / ${record.Data.operation} /`;
          console.log(name, diff && diff > 5000 ? `${diff}ms behind - MORE THAN 5s` : `${diff}ms behind`);
        } catch (err) {
          console.log(err);
          console.log(record);
        }
      }

      iterator.iterator = result.NextShardIterator;
    }
  });
})();
Running The Script
Provided you have saved the script in index.js, you can then run it this way ⬇️, changing the region and credentials as needed. The example uses the standard AWS_ACCESS_KEY_ID and AWS_SECRET_ACCESS_KEY, but the AWS CLI also provides other methods of authentication. For more information, refer to Configuring the AWS CLI.
export AWS_ACCESS_KEY_ID="******"
export AWS_SECRET_ACCESS_KEY="******"
export AWS_REGION="us-east-1"
export AWS_DEFAULT_REGION="us-east-1"
npx zx ./index.js
What The Script Does
The script:
Fetches information about the shards of each stream
For each stream iterates over messages, starting at the provided date
For each message, compares the date of the message to the date of the event itself
Reports the difference
If the script reports no delay (for instance, each message is only a few ms behind), but you are experiencing delays in your systems, then it means that there is something happening with the consumer on your end. Let’s look at some common issues.
Common Issues
The Delay Is On Arc XP’s side
If you were able to run the script and it reported a significant delay, open a ticket on our support portal and provide the command's output, the name of the Kinesis Stream, and the timeframe of the problem. If the problem started occurring recently and you know when, having the exact date can help diagnose the issue faster.
The Consumer Is Too Slow
This is the most common issue and occurs frequently while a migration is running. If your consumer is able to process 100 changes/minute, for example, this will work fine most of the time and will handle typical editorial activity. If, however, you start migrating content at the same time, your stream will start receiving not only messages from editorial changes (Composer), but also changes from the migration, which is likely to occur at a much faster pace.
The first thing to verify is: Is there any migration running? If the answer is yes, that might be the reason why your consumer appears to be “behind”. Slowing down the migration or stopping it temporarily may allow it to catch up enough to return to a state of no delay.
The Consumer Is Not Consuming All Shards
A Kinesis Stream is composed of Shards. You can think of a Shard as a “pipe” for the events/messages. A Stream will have at least 1 Shard, but may have more than one (we often provision two). Shards are used for multiple purposes, though the main use case is simply to increase throughput.
The concept of Shards is important because when writing a Consumer for a Kinesis Stream, underlying libraries and programs often times follow the pattern of 1 Shard = 1 Worker. It is thus possible to run into misconfigurations (the code listens to 1 Shard, but the stream has 2, and thus 50% of events are missed) and crashes (the code uses 1 Worker per Shard, but one worker has crashed, missing again 50% of events), which from outside perspective present themselves as “some of the content is being processed correctly, but not all of it”.
To ensure that all shards are being consumed, we recommend adding some form of reporting to your code, either in the form of log statements, or through metrics, to ensure that you can keep track of the Consumer’s activity, on a per-shard basis.
You can identify the number of shards of your stream using the AWS CLI:
aws kinesis describe-stream --stream-name <STREAM>
The Consumer Has Crashed
For one reason or another, sometimes, processes stop or crash. Similar to Shards above, it is helpful to have some level of reporting that the Consumer is alive, for example:
while (receiving messages) {
  if (messages) {
    foreach (message) {
      print "Processing message ..."
    }
  } else {
    print "No message, waiting X seconds"
  }
}
Having such messages in your logs will make it easier to identify if a process stopped or is otherwise blocked.
Improving Monitoring
If you made it this far, chances are you ran into some issues with your Kinesis Stream. To detect issues faster, we recommend that you implement a monitoring solution internally. At the very least, your monitoring solution should report:
Each time a message has been processed. This will allow you to easily and quickly alert when processing stops entirely. If you normally process 1000 messages per day, and you receive no message during a 12h period for example, then it is likely that something went wrong and this requires investigation.
The delay between the time of the event, and the time of the Kinesis message. As you saw in the debugging script, each message comes with a field named
ApproximateArrivalTimestamp. You can compare this time with the time inside the event, and report on the difference. If the difference starts to exceed a couple seconds, then an alert can be raised.The delay between the time of the event, and the current time. This is different than the metric than above. The metric above monitors when the message was available. This metric monitors when the message was processed. A big gap between these two metrics indicates that you may need to rework how you process messages, as your processing is not able to keep up.
Special Note on In-line Processing
If you process messages "in line", for instance, within the same code that's reading from the stream, and your processing is slow, you may report delays in reading the stream. It might thus appear that Kinesis is slow or late, but that is not necessarily the case. Take this example:
A message arrives in the stream, followed shortly after (100ms) by a second one
The code processes the first message in 5s
Once processing is done, the focus goes back to the Kinesis reader, which picks up the second message
The code compares the time of the event to the current time and notes a 5s delay
In the example above, the second message was available 100ms after the first one. But because processing happened in-line, the code in charge of reading it from Kinesis had no opportunity to go fetch it while processing of the first message was occurring. It fetched it 5s later, when processing of the first message ended, and it was able to do it. This is not a delay in the stream.
This issue occurs frequently, so we provide the script above. The script will tell you the time the message was available to be consumed, which may differ from when it was consumed. If you notice significant differences between what the script reports and your monitoring, you may need to decouple the processing of messages from reading messages.
Still Need Help
If you were unable to run the script, or if you are still experiencing issues after running through all the debugging steps, open a support ticket and our team will assist you. Similarly, if this article was unclear or could be improved, let us know so we can improve it for all Arc XP customers.