Migration Center reporting dashboard
The Migration Center reporting dashboard provides information about the overall progress and estimated completion time for content imports into Arc XP. Whether you’re migrating content from a previous CMS, external feed, or another source, the dashboard provides a high-level view of what’s currently queued for import and how long it may take to complete.
Located on the Migration Center homepage, the dashboard displays panels with key information about all active migration streams. The dashboard is designed to give a broad understanding of progress and remaining time, rather than detailed success or failure metrics.
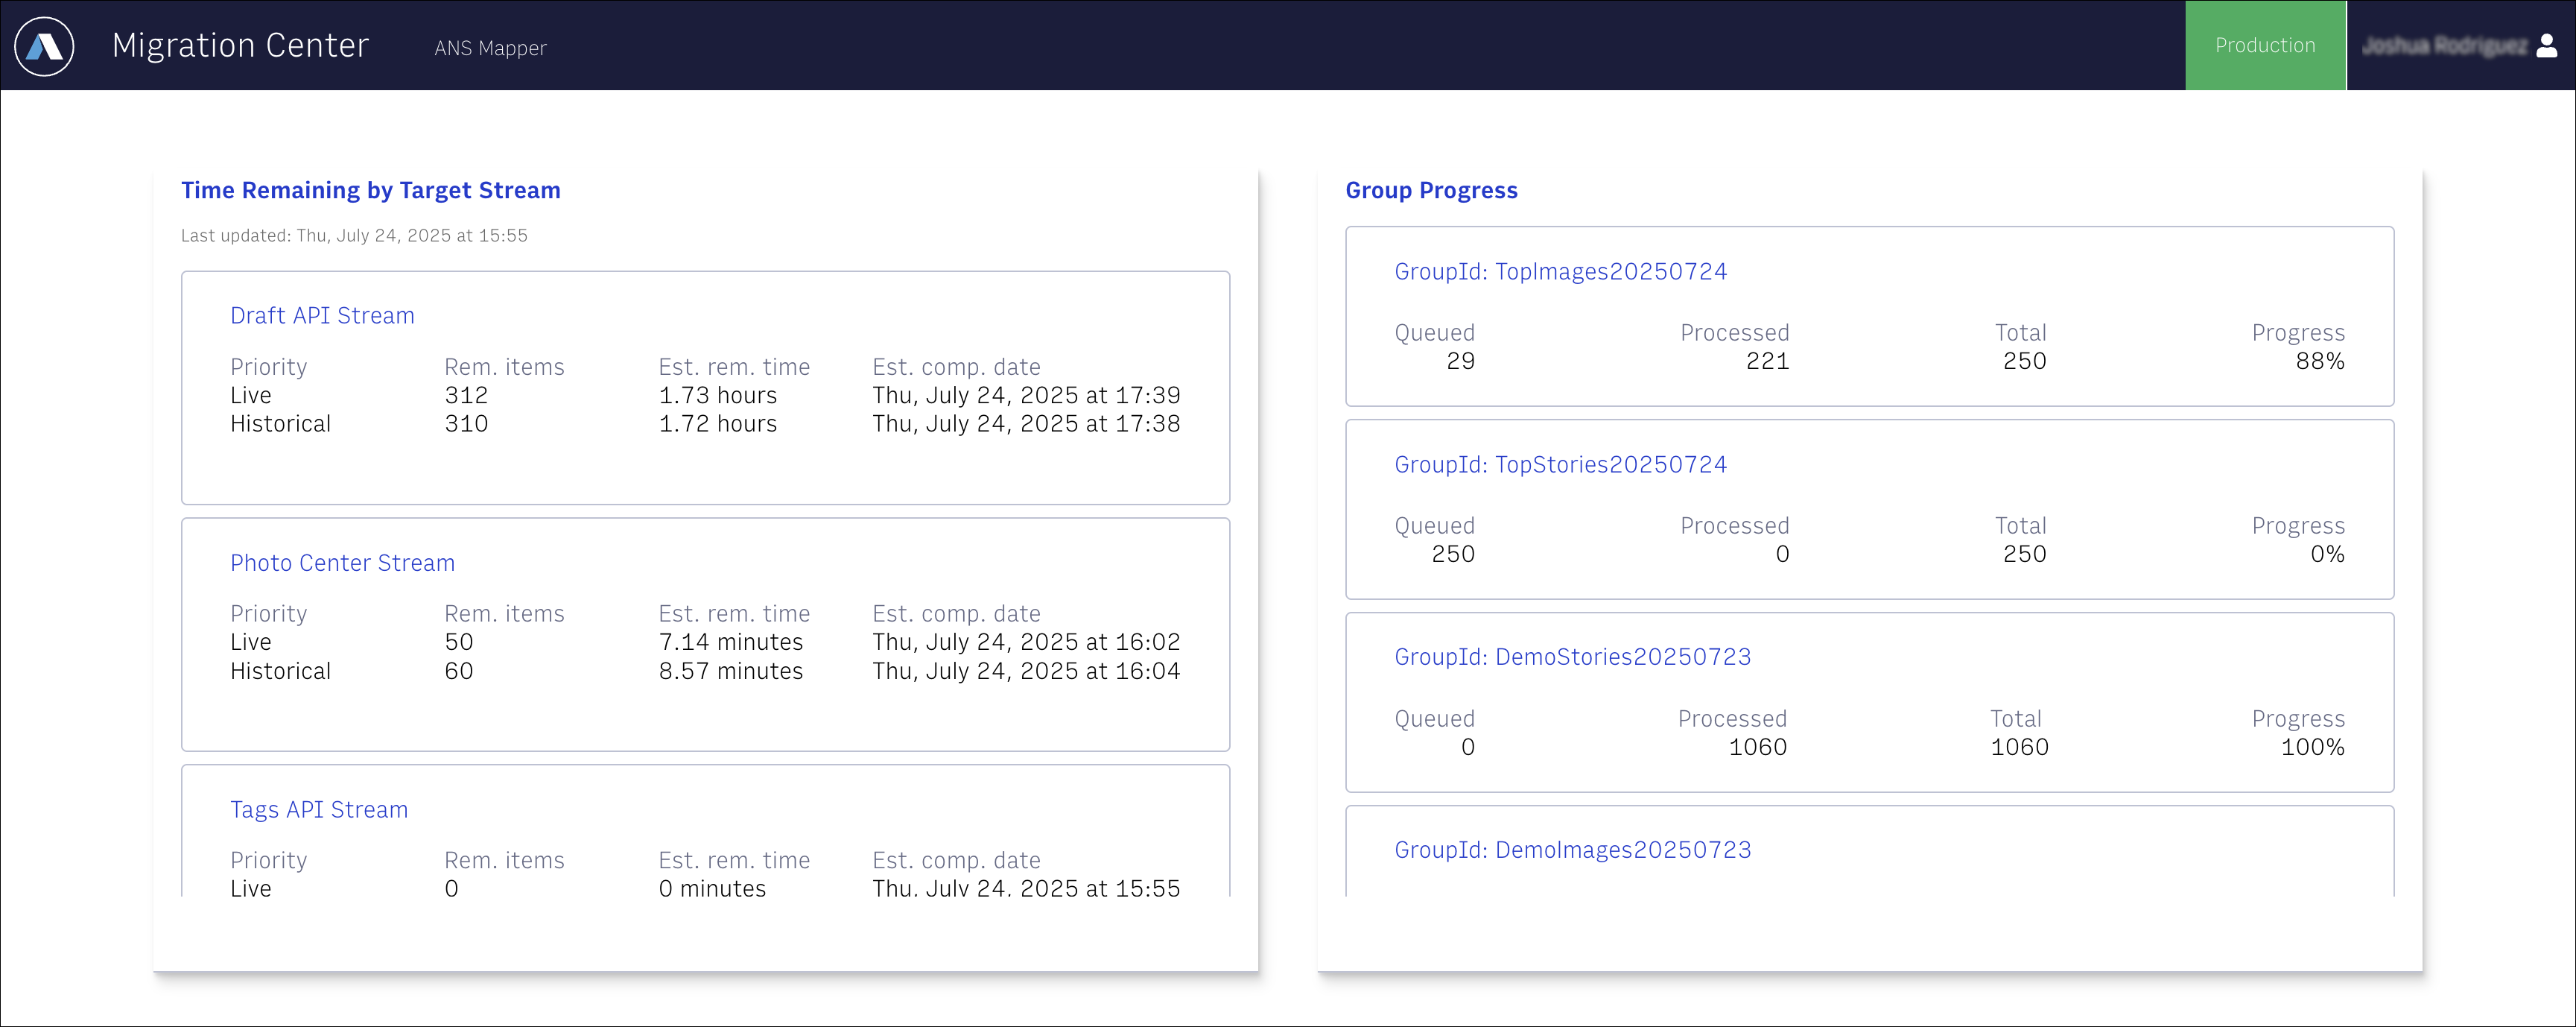
The Target Stream panel displays all content submitted to Migration Center organized by specific outbound endpoint (Draft, Video, Tags, Authors, Photos). The data displayed also provides details on the status of the priority lane lanes (Live, Historical), the remaining items left to process and estimated time remaining to complete loading and expected completion date.
The Group Progress panel displays Migration Center jobs submitted with a GroupId. Tracking submitted jobs by GroupId allows you to see the status of each job you have submitted to Migration Center so you can monitor submitted tasks.
For more granulation information, like success and failure status, refer to the reporting endpoints available in the Migration Center API documentation.
To reduce load on the Migration Center Reporting API and improve performance, Arc XP uses a caching system for the reporting dashboard.
When you open the Migration Center dashboard (home page), the data you see is cached for 15 minutes. During that time, the report does not update, even if the underlying migration activity changes.
After 15 minutes, the cache expires. Reloading the page then generates a fresh, updated report.
If you leave the page open to monitor migration status in real time, note that the dashboard automatically refreshes every 15 minutes to keep the information current.
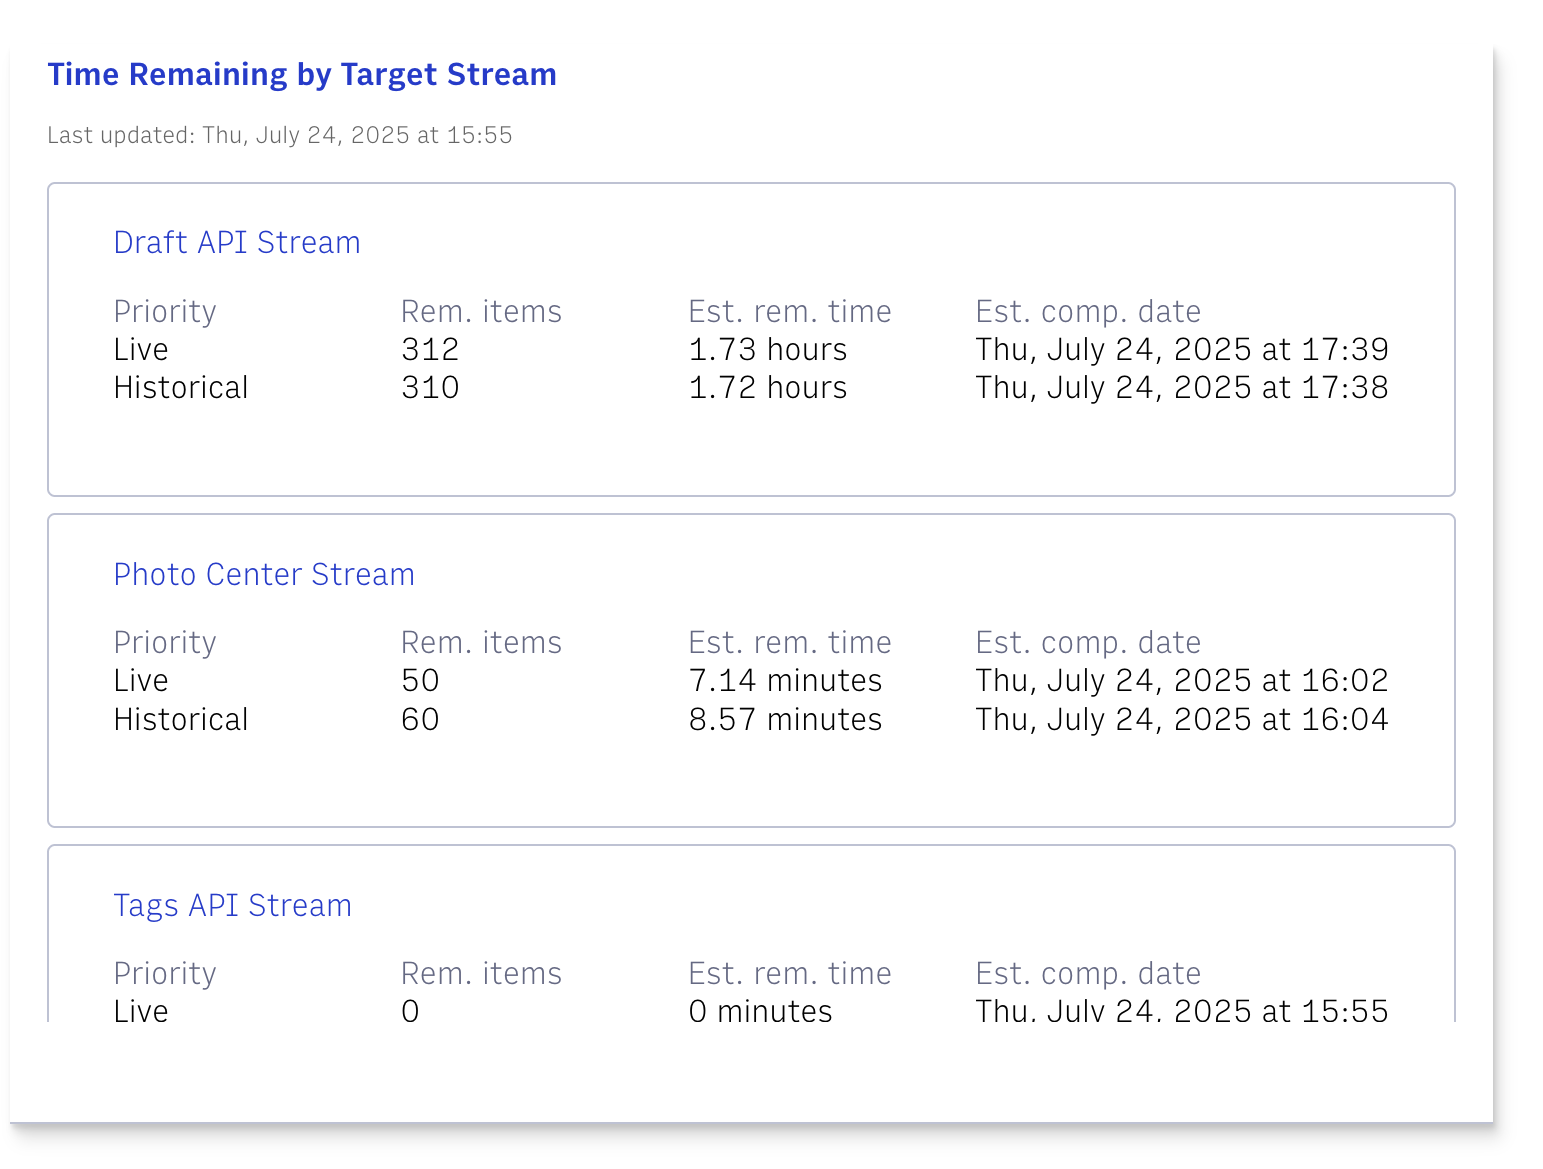
You can always check when the current report was generated by looking at the timestamp in the top-left corner of the Time Remaining by Target Stream panel.
Use this panel to view how much time is left for content to finish importing into each target stream. A target stream refers to one of the Arc XP applications or APIs where content is delivered during migration.
The dashboard displays the following target streams:
Draft API Stream - Used for story content. This includes ANS types like story and redirect.
Authors API Stream - Handles
authorANS type data.Tags API Stream - Receives
tagANS type data.Photo Center Stream - Transfers Photo Center assets, including
imageandgalleryANS types.Video Center Stream - Sends
videoANS data to Video Center.
Each stream contains two priority levels:
Live - Reserved for timely or urgent content. Always takes priority.
Historical - The default queue for older or less time-sensitive content.
For each stream and priority level, you see the following columns:
Priority - Displays whether the content is in the live or historical queue.
Rem. items - Displays the number of items still waiting to be processed.
Est. rem. time - Displays an estimate of how much time is left to process the remaining items. Time is shown in the most relevant unit, for example, minutes, hours or days.
Est. comp. date - Displays the estimated date and time when all items in that queue will be fully processed.
Note
These values are estimated and can shift based on operational lead or activity in downstream services.
Streams are listed in order of estimated completion time, with the longest-running queues shown at the top. If a stream has no items left to process, it shows 0 remaining items, 0 minutes estimated time, and the current date as the completion time.
Keep in mind that this panel works best when there’s a significant amount of content being processed. When the volume is very low, the system may show a completion time of less than a minute, which can result in all streams showing the same completion date. In these cases, sorting may appear slightly out of order due to how the data is pulled and updated in real time.
Use the Group Progress panel to track the status of related content items that you’re migrating together. When using the Migration Center API, you can group content by shared characteristics, like time period, section, location, author, or any combination, by including a groupID in your API requests. This tells Migration Center to treat those items as part of the same batch or context.
The panel displays progress for any Group IDs with activity in the past two weeks. Group IDs with the most recent updates appear at the top of the list.
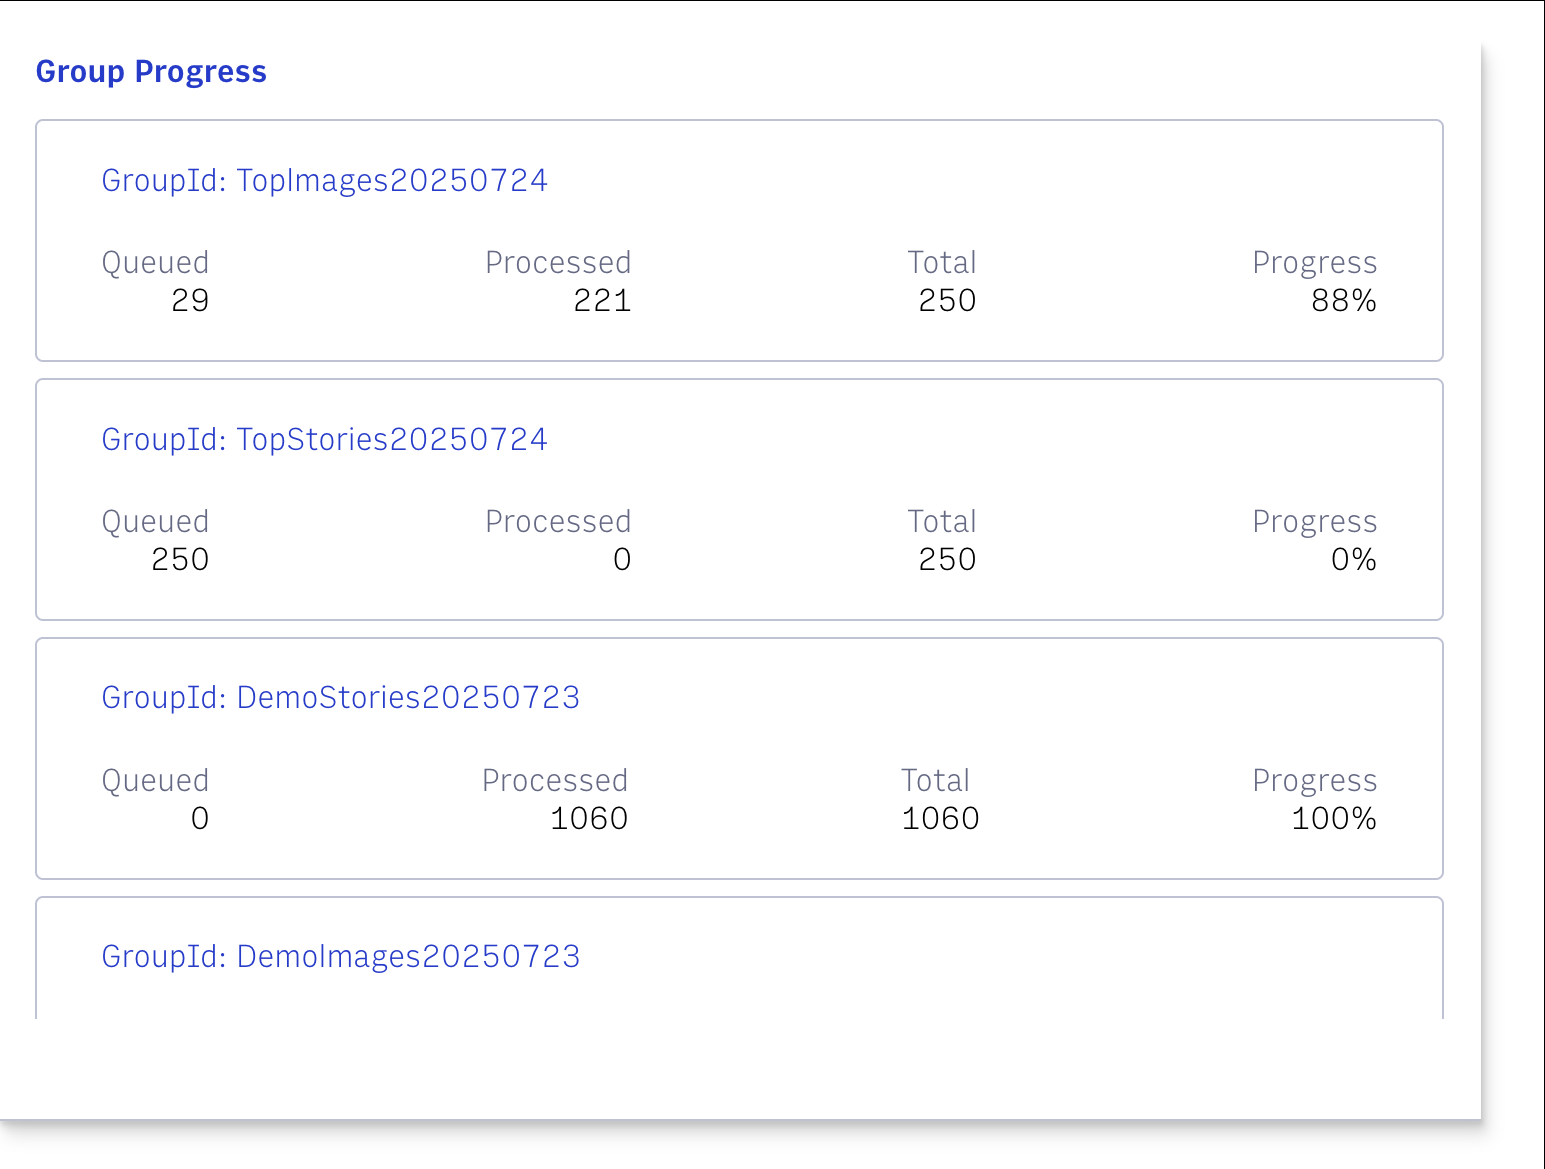
For each Group ID shown, you see the following details:
Queued - Displays the number of items still waiting to be processed.
Processed - Displays the number of items that have finished processing, including both successful and failed results.
Total - Displays the total number of items submitted for that Group ID.
Progress - Displays the overall percentage of items completed.