Using the Video Center Analytics Dashboard
The Video Center Analytics Dashboard provides insights into your videos' performance and audience engagement. This dashboard offers a comprehensive view of key metrics across engagement, monetization, and video performance, helping you both analyze trends and troubleshoot issues affecting your content.
With flexible filtering options, you can view metrics across all your sites, a specific site, or even drill down to an individual video. You can also analyze data over various timeframes, including today, the past seven days, or the past 30 days.
Consider the following dashboard characteristics:
This dashboard displays data for videos on demand (VOD) only. Live stream data is excluded unless converted into VOD format.
The dashboard does not display data from the mobile SDK.
Prerequisites
To use Video Center Analytics Dashboard, you must meet the following criteria:
Use Video Center
Use the Powa video player (and not a third-party video player)
Accessing the Video Center Analytics Dashboard
Follow these steps to access the Analytics Dashboard.
Navigate to Video Center.
Click the Performance tab. The Video Center Analytics Dashboard opens.
Dashboard Metrics
The dashboard contains the following metric categories.
Engagement
The Engagement section of the analytics dashboard displays metrics related to how users are engaging with your videos and how your videos are performing on your site.
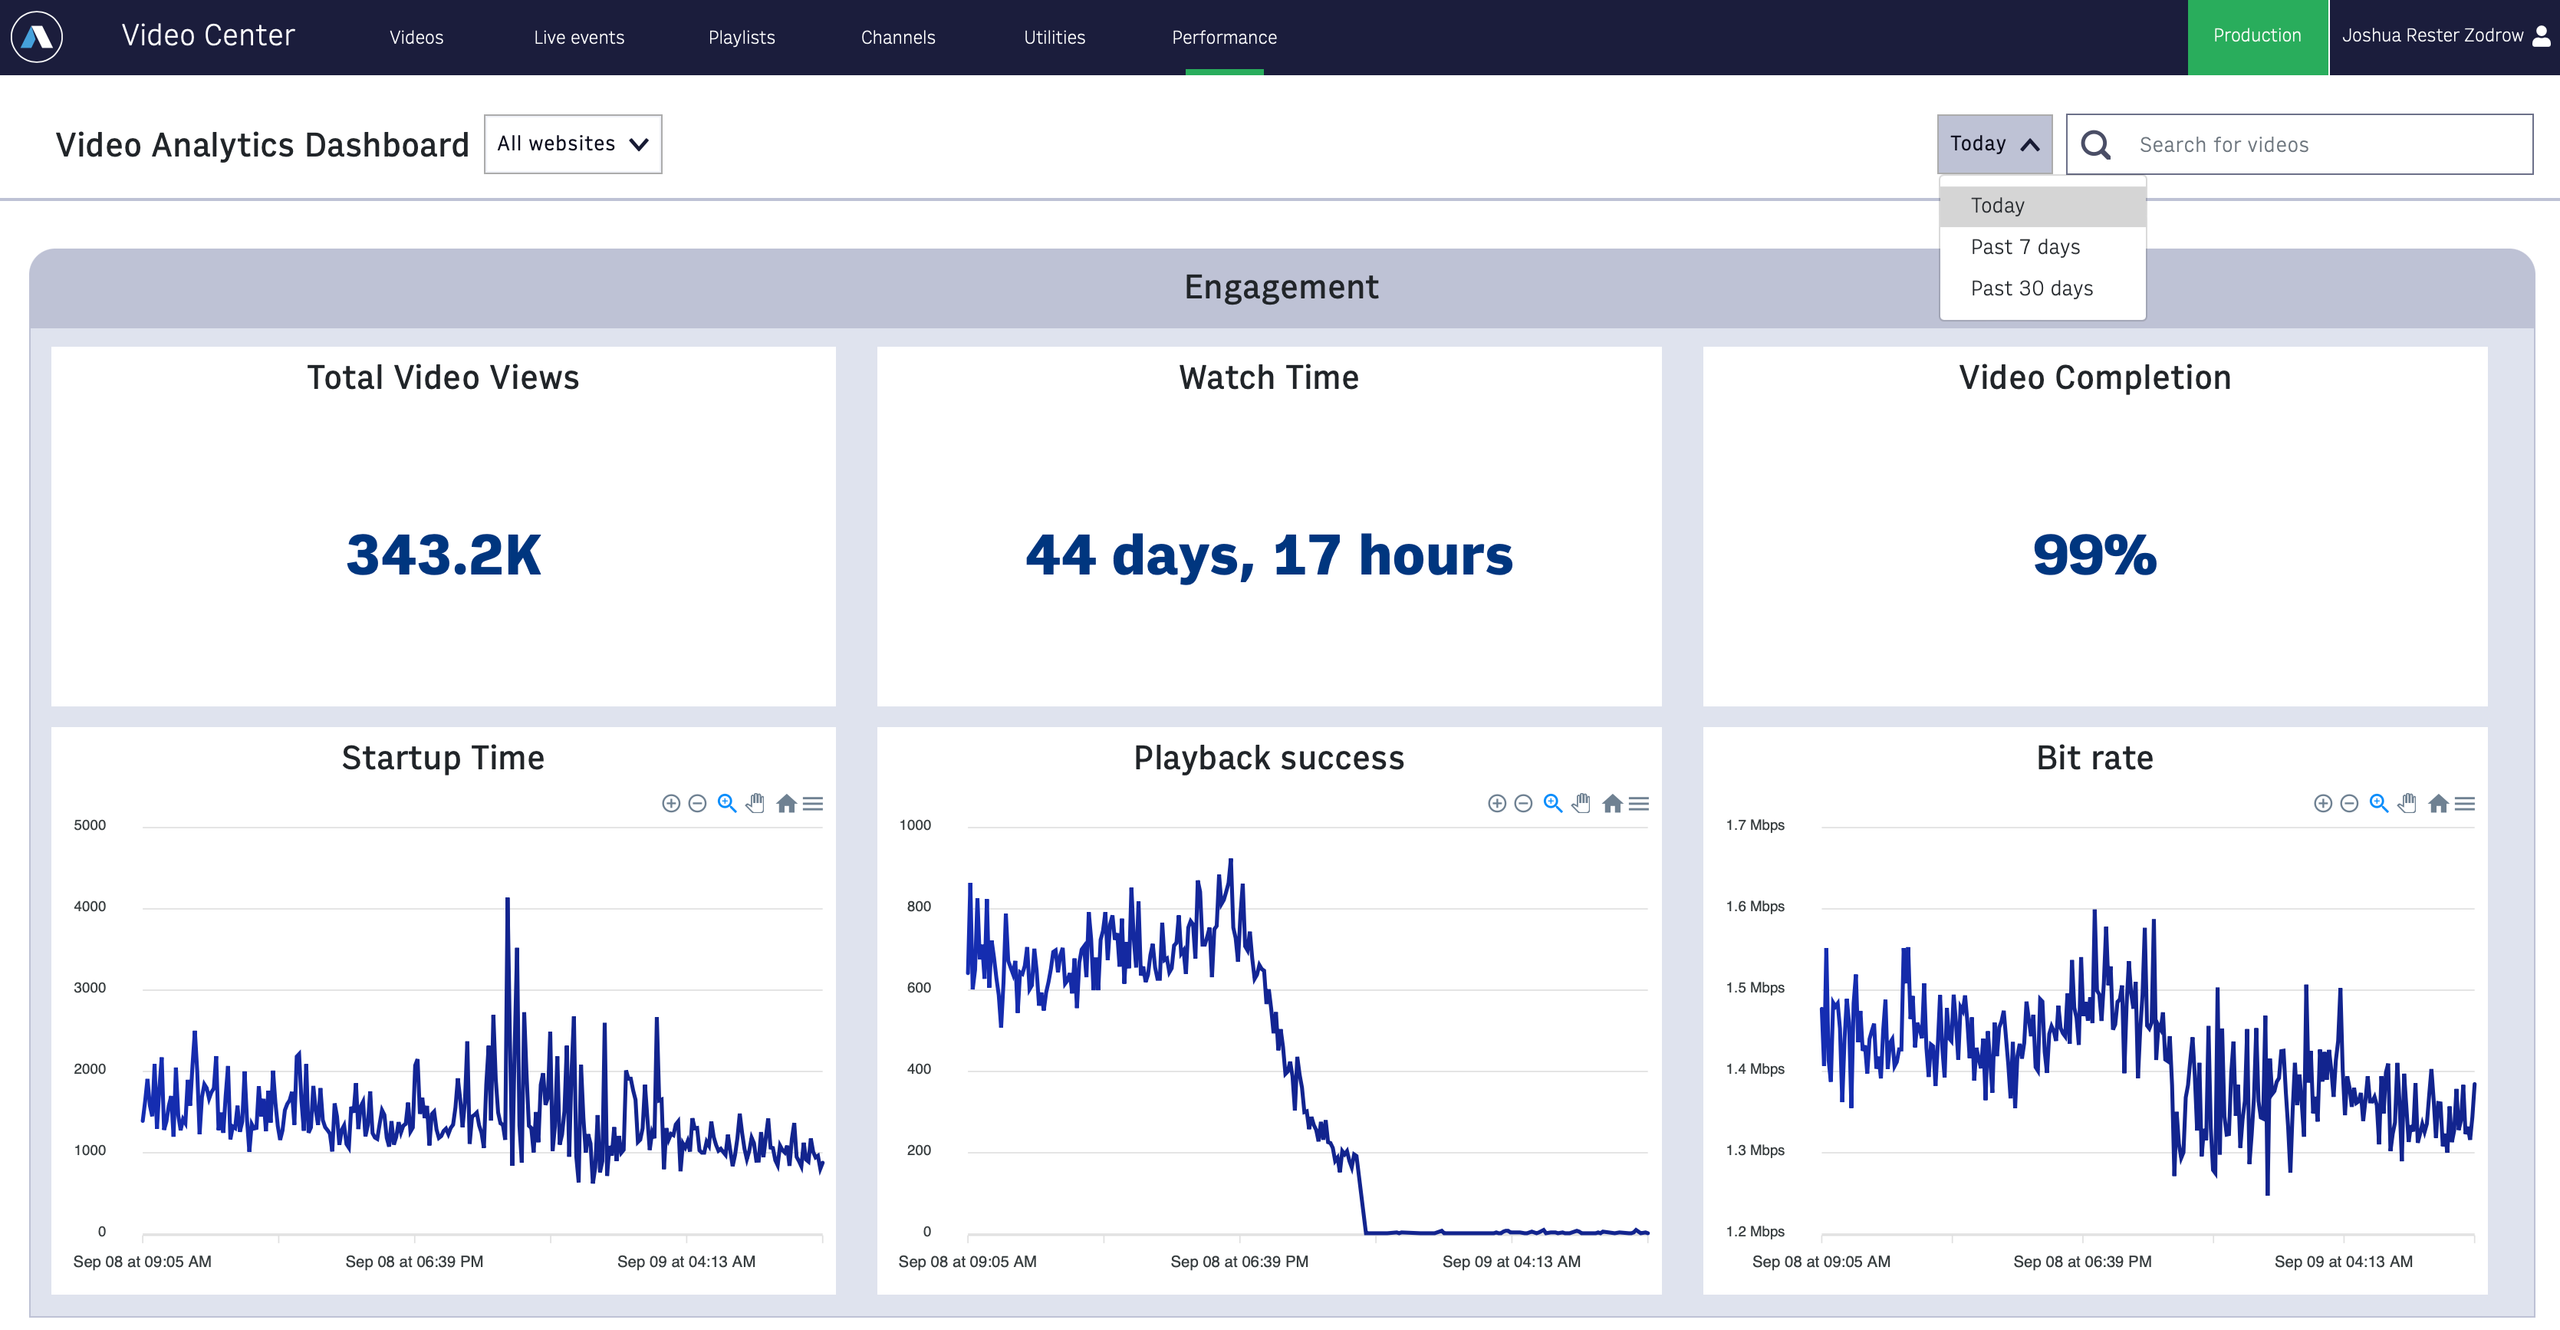 |
Total Video Views - displays the total number of video views. A view is an attempt (successful or not) to play a video. A view is counted when a viewer clicks play or if playback is started programmatically. Each view is tracked until the playback is ended (for example, by the viewer navigating off the page with the video being played) or for up to an hour after playback stops without being ended. If the user taps play, the video starts to load and fails, that counts as a single view. If a user taps play, starts watching the video, pauses, then resumes, that counts as a single view. A user can watch a single video multiple times in a single view by looping or seeking to the start of the video.
Watch Time - The total time your videos have been viewed. The watch time for a view is the cumulative amount of time the user spent watching or attempting to watch the video. This metric includes actively playing content, starting up, rebuffering, and seeking. For example, if user watches for 90 seconds, has 4 seconds of rebuffering, spends 2 seconds seeking by rewinding and then watches 60 more seconds, the total watch time is 156 seconds (90 + 4 + 2 + 60).
Video Completion - displays the average aggregate of available video time that users have completed, in a percent format. This metric includes ad duration on your video, meaning if a video is 2 minutes long and has a 30-second ad, the video’s length is considered 2 minutes and 30 seconds.
Startup Time - displays the time in milliseconds that the viewer waits for the video to play after the page is loaded and the player is ready. It specifically measures from when the player has been instructed to play the video, either directly by the user or through autoplay, to when the first frame of video is showing and the playhead is progressing. In the case that the player is configured with a pre-roll ad, Startup Time is the time until the first frame of the pre-roll ad is displayed.
Playback success - displays the frequency that users are able to playback videos. Playback success for a single view is a score of 0 (playback failure), 50 (user exited before video start), or 100 (successful playback).
Bit rate - displays your videos' weighted average bit rate over time in megabits per second (mbps).
Monetization
The Monetization section of the analytics dashboard displays reports related to how ads on your videos are performing. This dashboard tracks any ad you run through the Powa player.
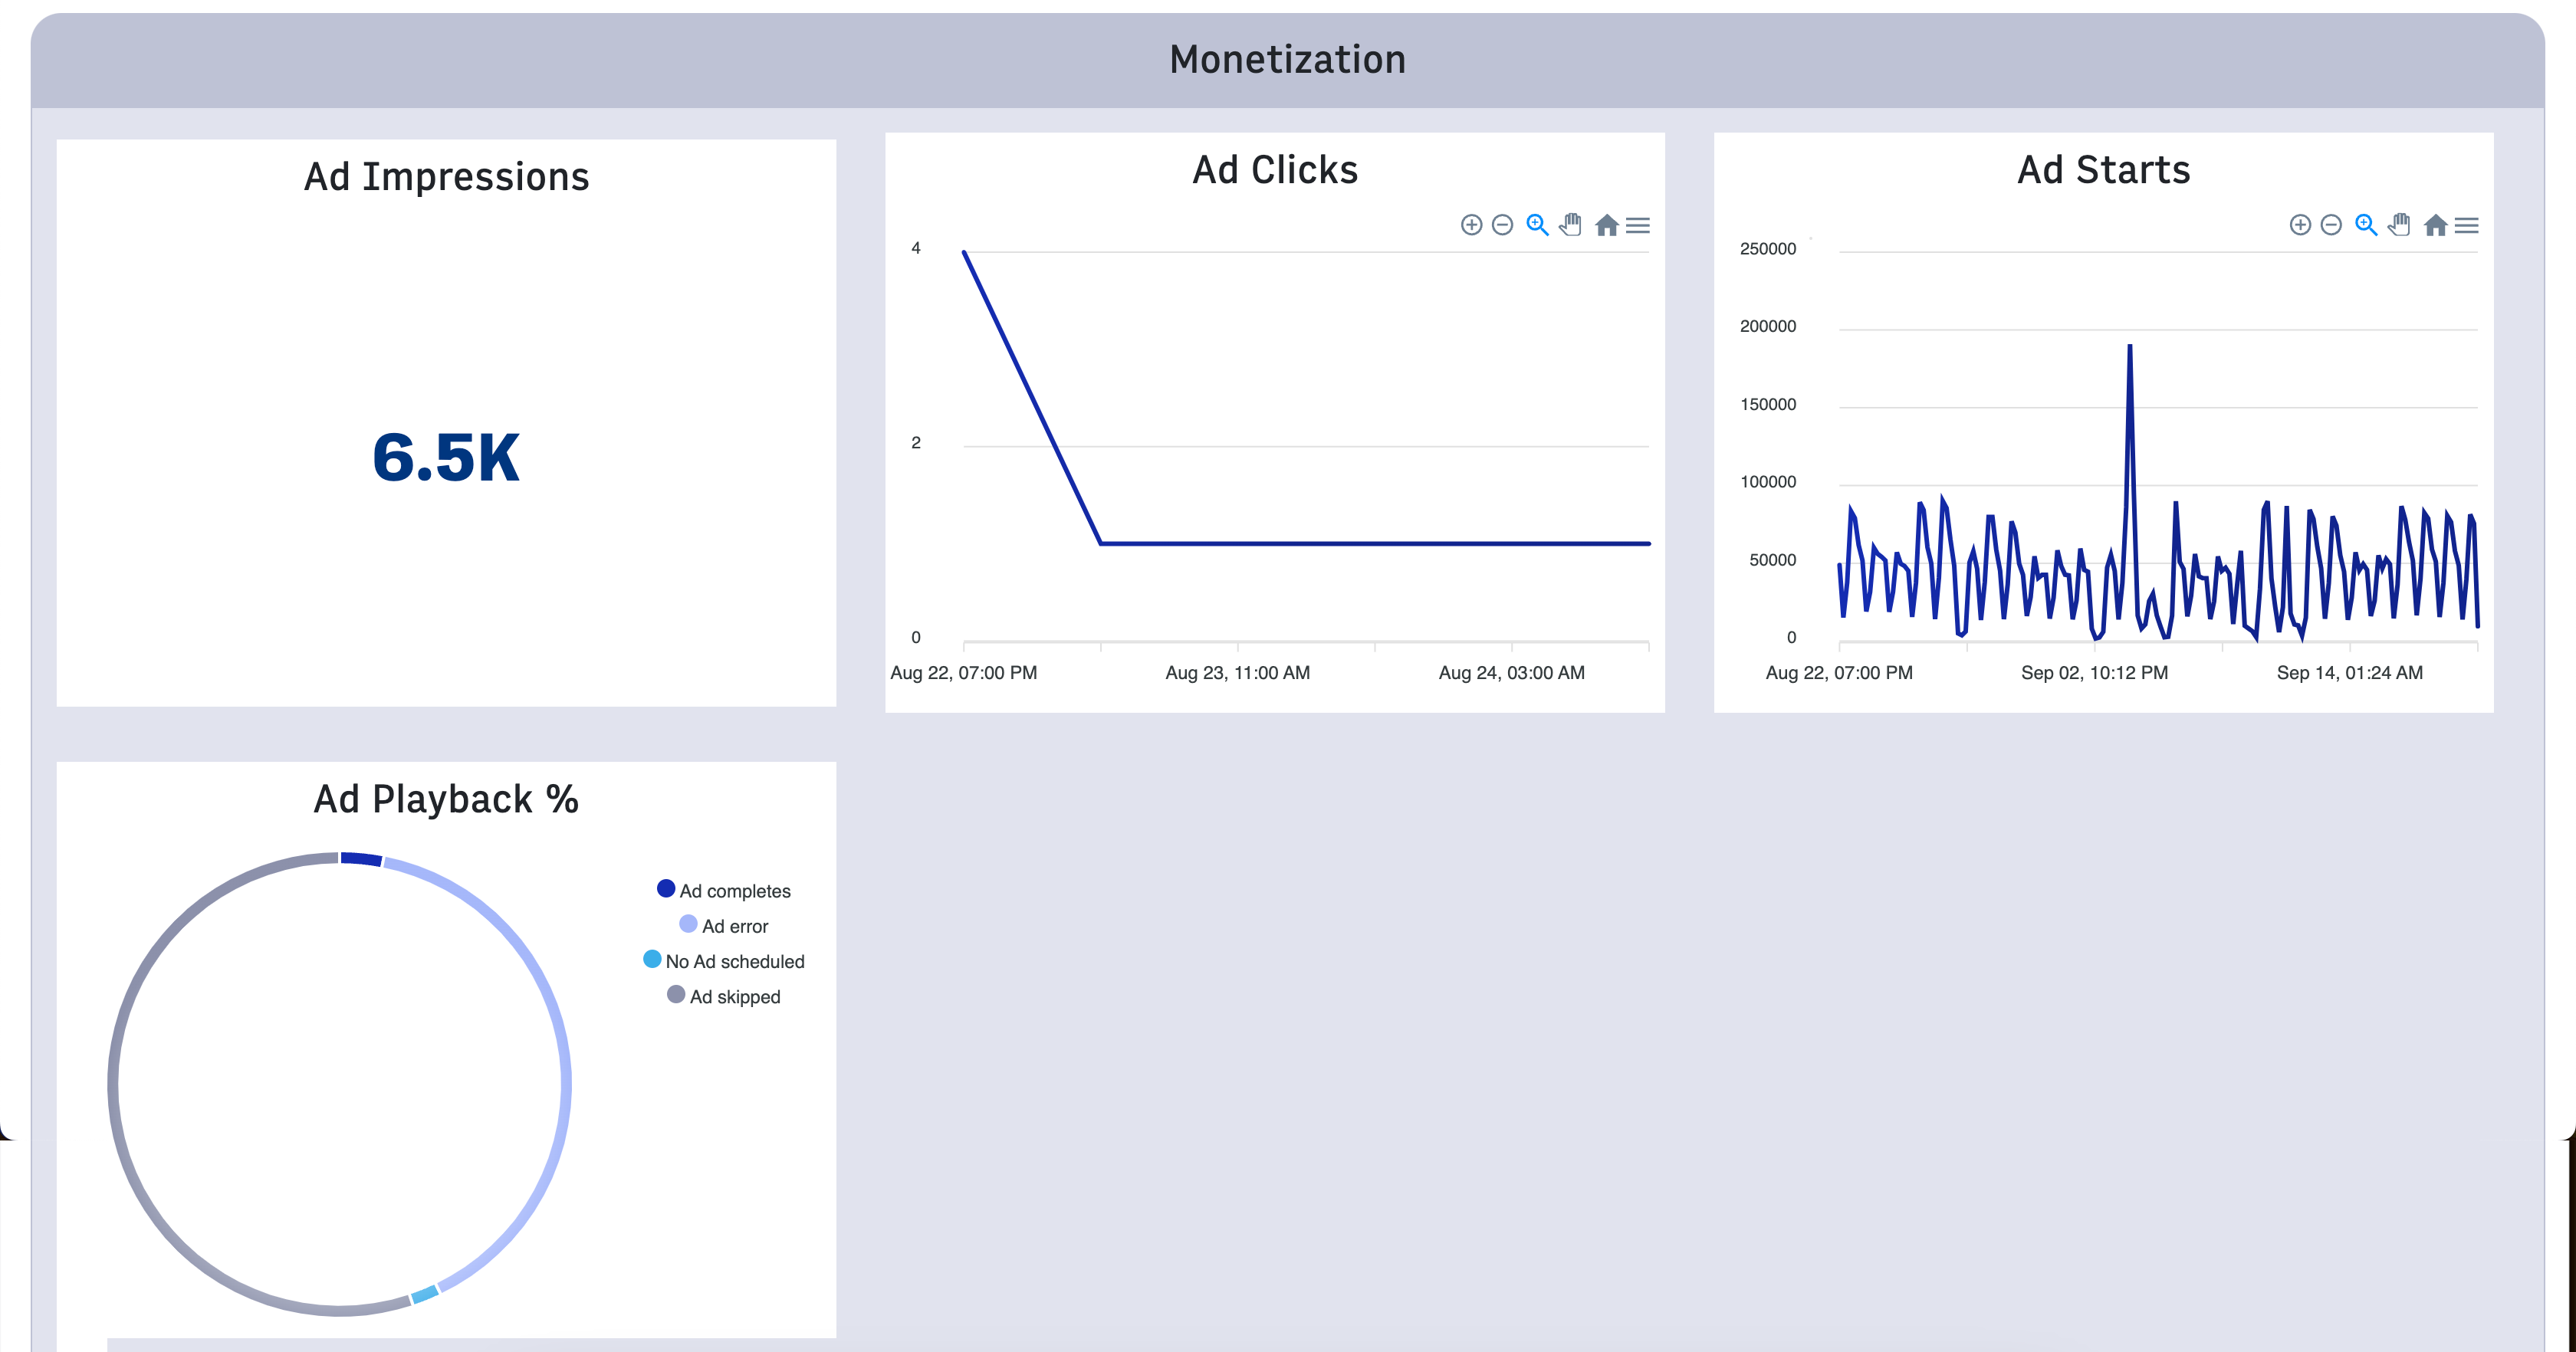 |
Ad Impressions - displays the number of times an ad has been displayed to a user in your videos.
Ad Clicks - displays the number of clicks ads receive over time.
Ad Starts - displays the number of times an ad starts in a video.
Ad Playback Percent (%) - displays the percent of total amount of ads completed (the entire ad played), errored (the ad errored), or skipped (the user skipped the ad before it completed).
Errors
The Errors section of the analytics dashboard displays reports related to errors in the video and Powa player. For guidance on troubleshooting these errors, see [Video Center Error Troubleshooting Guide].
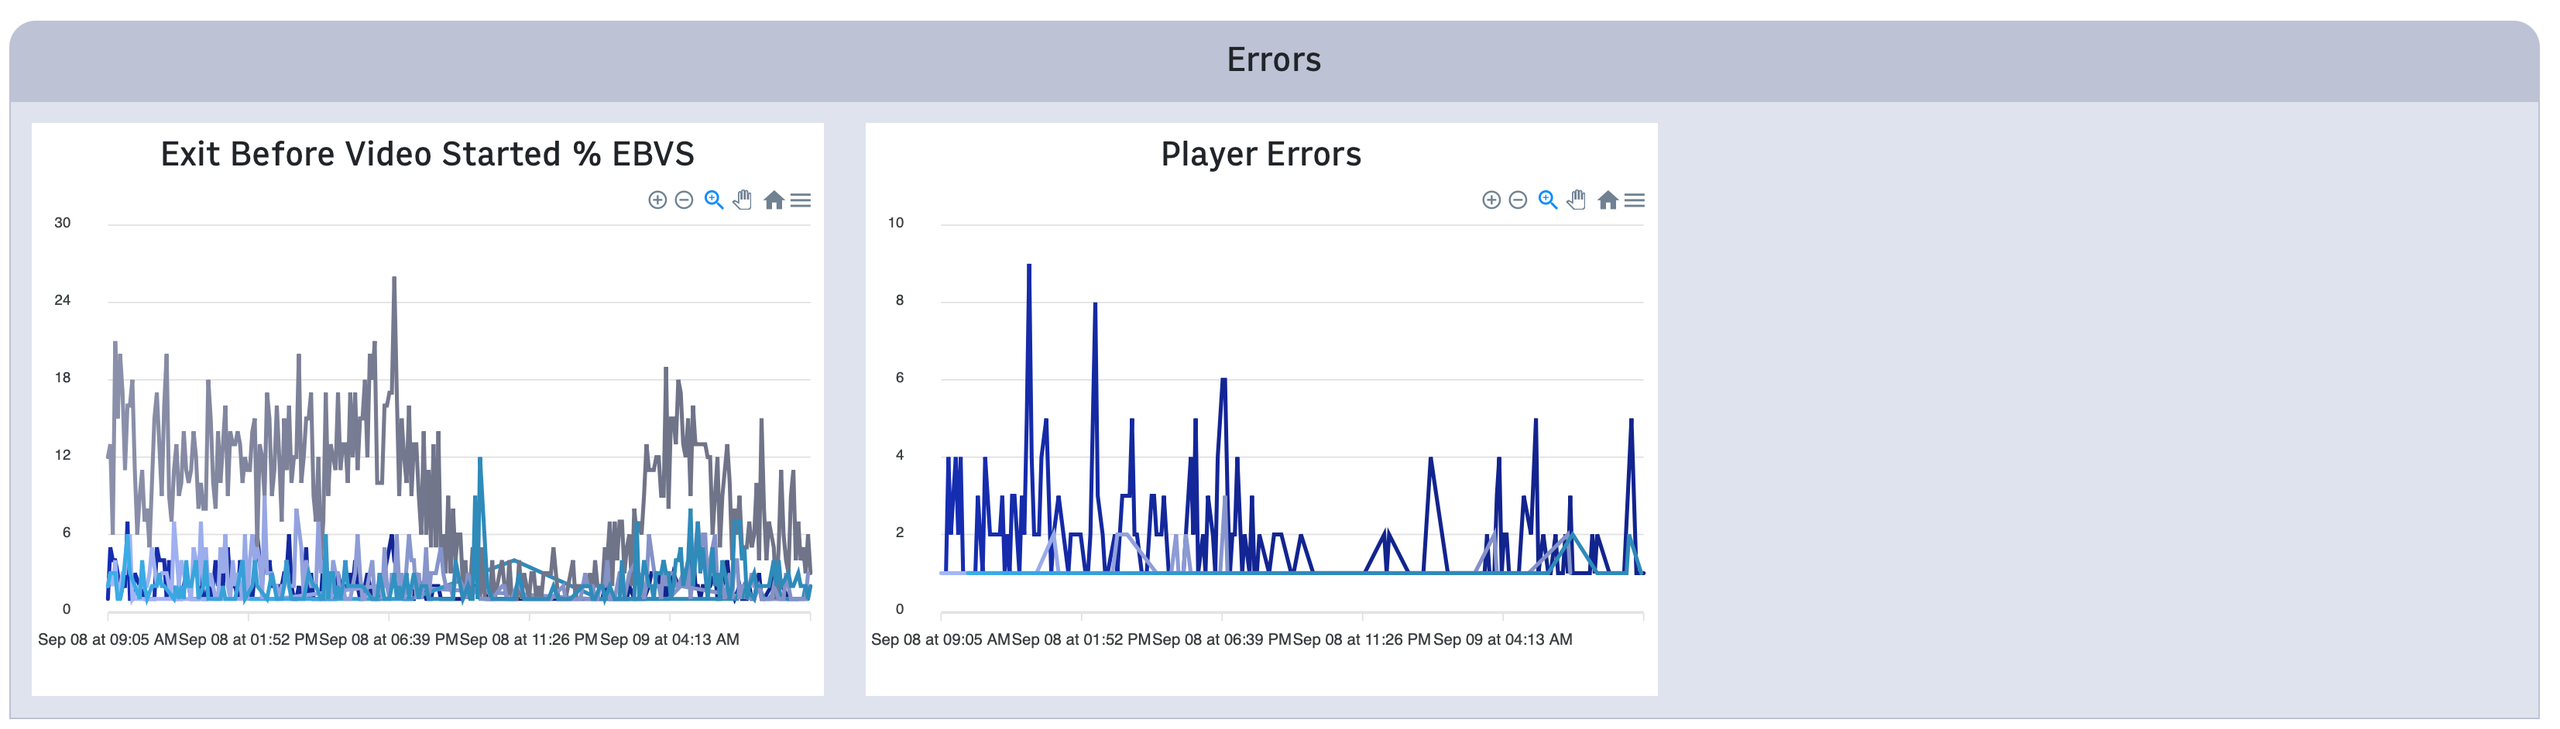 |
Exit Before Video Started % EBVS - displays the percent of playback attempts that end before the video starts playing by device (Android, Mac, and PC).
Player Errors - displays the total number of Powa player errors broken down by error type: unknown player error, media error, or network error.
Most viewed videos
The Most viewed videos section displays a list of your most-viewed videos across all your sites or a specific site. This section appears only when viewing video metrics for sites and not for an individual video.
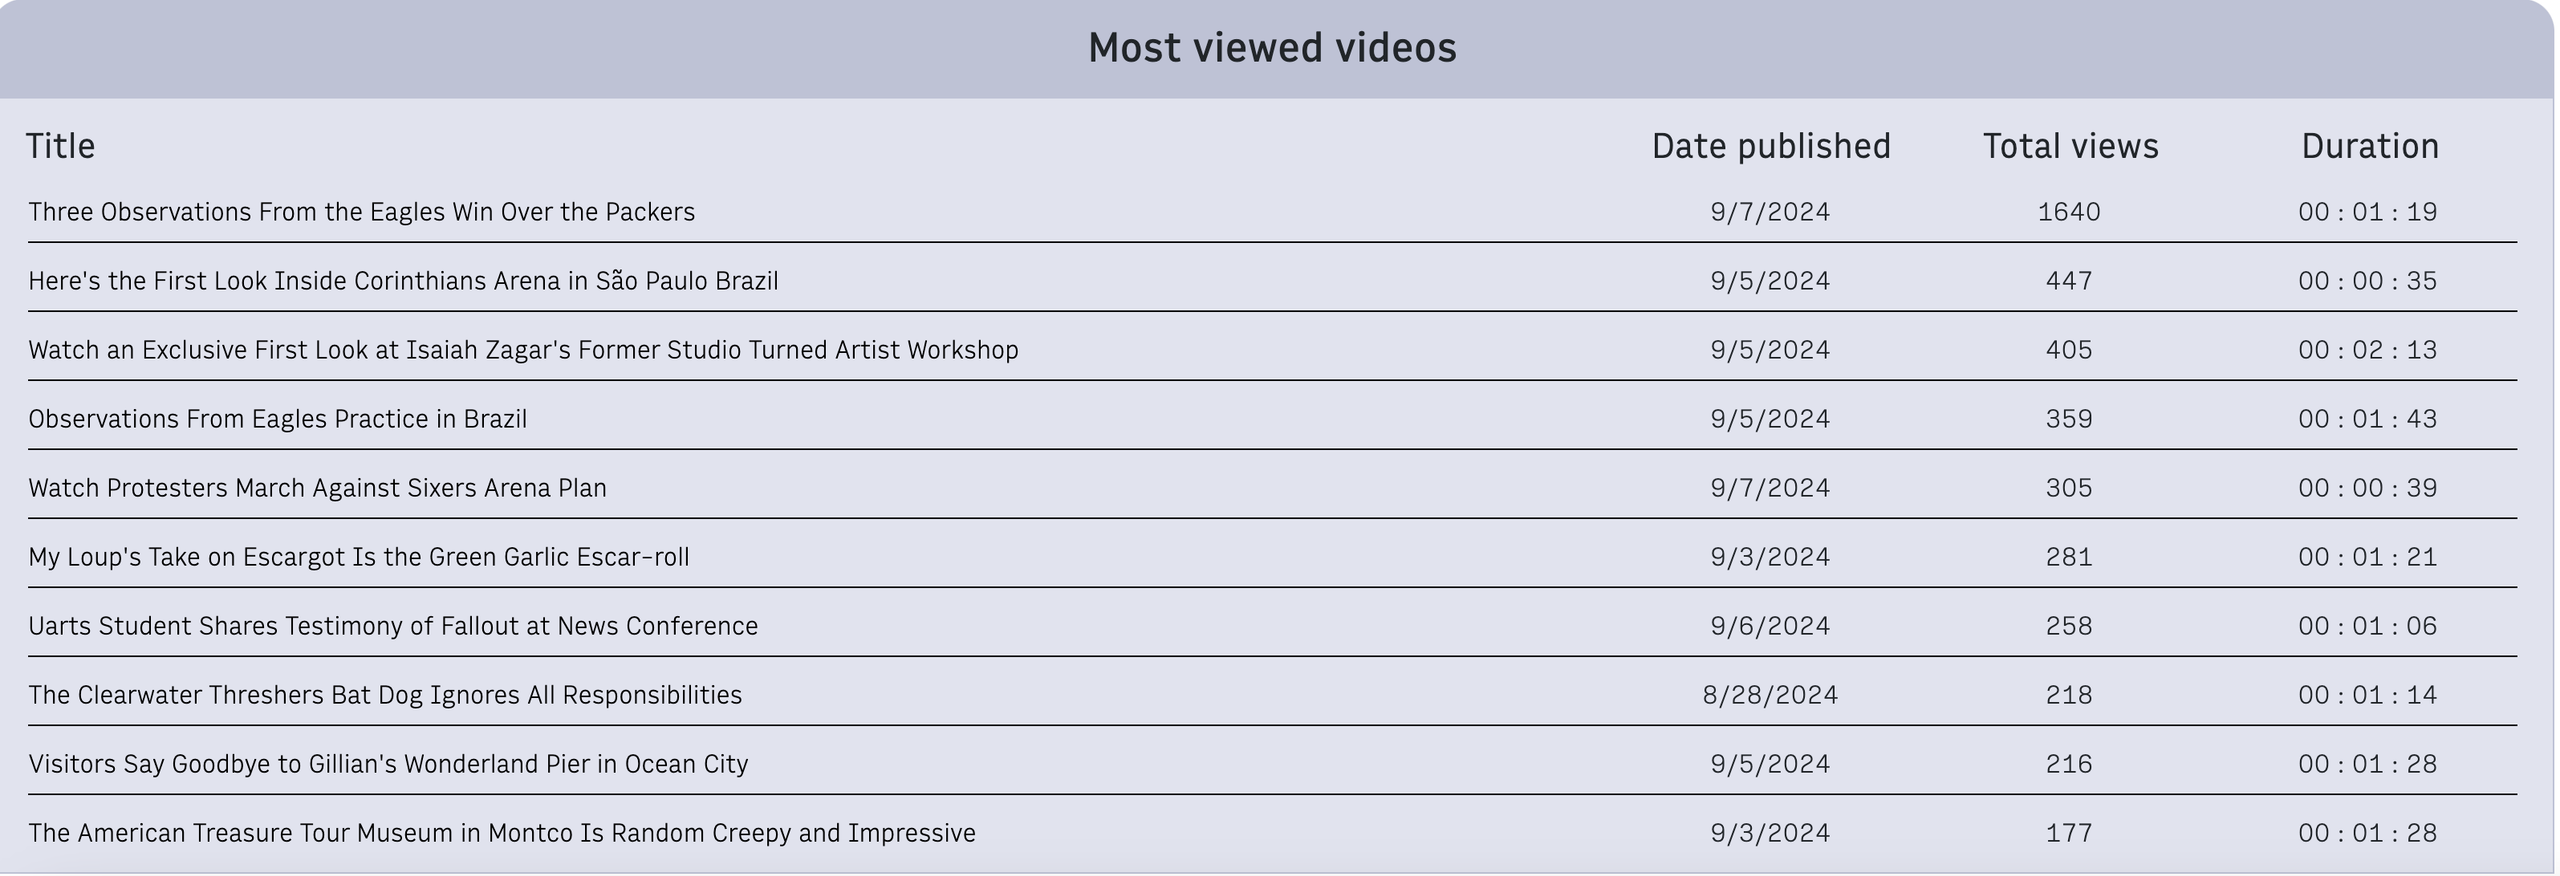 |
Click a video name to view that video’s specific metrics. This section displays the following details:
Title - displays the title of the video as saved in Video Center.
Date published - displays the date the video was published to your site.
Total views - displays the number of views this video received. See Total Video Views in the Engagement section for an explanation of how views are calculated.
Duration - displays the total length of the video in hours, minutes, and seconds.