Compass Analytics Overview
Compass reports on the stories it recommended to your readers and what those readers did with them. This page explains what each number counts, so the numbers you act on mean what you think they mean.
Key terms
Four definitions do most of the work. Getting these right is the difference between a number you can act on and one you’ll misread.
Impressions count views of a story
An impression means a reader actually saw a story in a recommendation slot on the page. It is not a count of how many times recommendations were requested, or how many lists were loaded. If a list of ten stories loads but the reader never scrolls to it, it contributes no impressions.
Only confirmed clicks count toward CTR
Compass sorts clicks into three groups:
| Click type | What it is | How to use it |
|---|---|---|
| Confirmed clicks | A click on a recommended story that Compass can match to a reader seeing that same story. | This is the Clicks number and the basis of CTR. |
| Context-only clicks | A click that came from a recommendation but couldn’t be matched to a reader seeing the story. | Real recommendation-driven engagement, but it doesn’t count toward CTR. |
| Unattributed clicks | A click with no information about where it came from. | Shows that interaction happened — nothing more. |
CTR is a floor, not an exact rate
Reader activity arrives at Compass in batches, and not always in order. When a click arrives before the matching view, Compass can’t confirm it, so it is never counted toward CTR. As a result, CTR slightly undercounts.
Use CTR the way it holds up: track it over time and compare one time window to another, where the undercount is consistent. Don’t treat a single figure as your exact click-through rate, and don’t expect it to match a rate from another analytics tool — the two are counting different things.
The four headline metrics
| Metric | What it counts |
|---|---|
| Impressions | Times a recommended story was seen by a reader in a recommendation slot. |
| Clicks | Confirmed clicks — clicks matched to a reader seeing that story. |
| CTR | Clicks ÷ Impressions. Shown as empty rather than 0% when there were no impressions at all. |
| Avg. served position | The average position of clicked stories in the recommendation list. 1.0 means clicks landed on the first slot. Lower is better. |
The Overview
Overview is the first thing you see when you open Compass, and shows analytics for the site selected in the left rail. The controls at the top apply to every section on the page:
- Time window —
Last 24 hours,Last 7 days, orLast 30 days. - Auto refresh — off, or every 1, 3, 5, or 10 minutes. You can also click Refresh at any time.
- Last updated N min ago — how old the data is, not when you last loaded the page.
- Stale data banner — Data may be stale. Last projected {ago} ago. appears when the data is more than five minutes behind.
Content recommendations
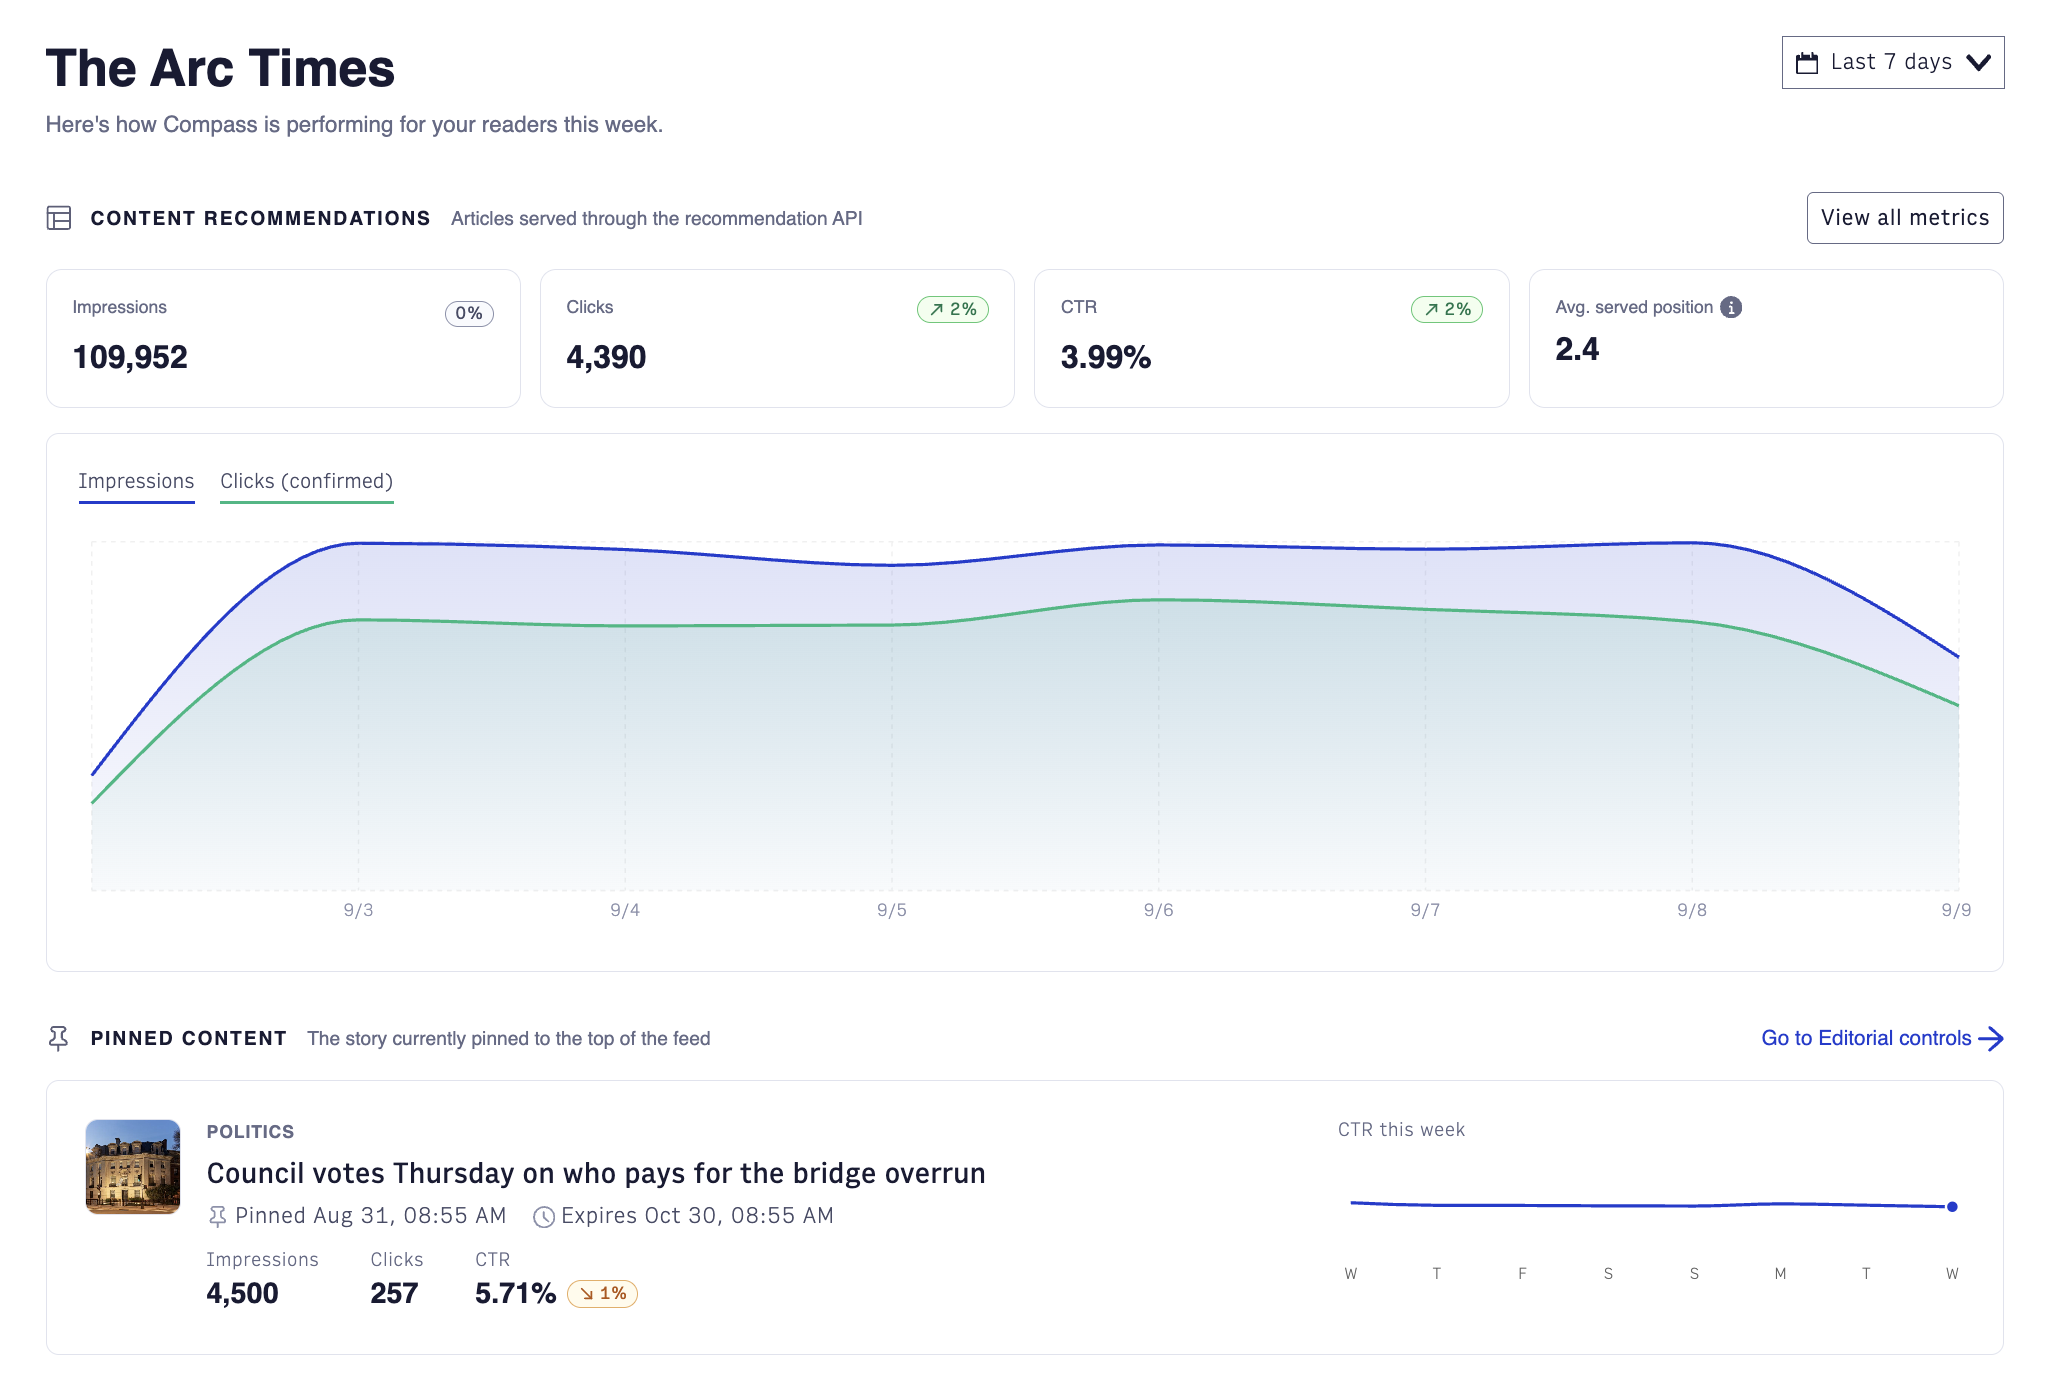
Articles served through the recommendation API. Four tiles — Impressions, Clicks, CTR, and Avg. served position — plus a chart over the selected time window.
Each tile shows an arrow comparing the selected window against the window of the same length just before it. For example, with Last 7 days selected, the comparison is with the seven days before that. If there’s nothing to compare against, the arrow is hidden — a missing arrow doesn’t mean “no change”.
Pinned content
The story currently pinned to the top of the feed. Shows the pinned story with its Impressions, Clicks, and CTR.
- No analytics for this story yet means the story has no activity yet — normal for a story pinned a few minutes ago.
- Analytics unavailable means Compass couldn’t load the data. This is a different problem; try refreshing.
Catch up cards
Modules that help readers catch up on stories they’re following. Shows the same three tiles as Content recommendations — Impressions, Clicks, and CTR — plus a CTR-over-time chart.
If you see Catch up cards are not enabled., no Catch Up cards have appeared on this site yet. This usually means Catch Up isn’t set up on the site. See Getting Started with Compass for setup.
The labels match Content recommendations, but Catch Up numbers read differently. See Reading Catch Up analytics below.
Advanced view
View all metrics in the Content recommendations section opens a technical view of the data that powers recommendations, aimed at technical teams investigating issues. For what it shows and how to act on it, see Compass Analytics: Technical Reference on the developer portal.
Reading Catch Up analytics
Impressions are counted per section, not per card
Each Catch Up card is made up of several sections, and Compass counts an impression for each one — usually three to five per card. So Catch Up Impressions are not the number of cards readers saw; reading them that way overstates card volume several times over.
Catch Up CTR uses the same impressions, which keeps it comparable to the Content recommendations CTR on the same page.
Not every card is measured
Compass only measures Catch Up cards built from stories a reader is following. Cards built from popular content — shown to readers Compass doesn’t know much about yet — are not measured. On a site where Compass is still learning about readers, readers may be seeing more Catch Up content than the numbers show.
Story-level Catch Up history is short
Compass keeps story-level Catch Up results for only about 25 hours, so it can’t answer “how did this story do in Catch Up last week?” The Catch Up tiles and CTR chart on the Overview aren’t affected and cover the full time window.
Empty or broken?
A blank-looking dashboard can mean very different things.
| What you see | What it means | What to do |
|---|---|---|
| Zeros across the window, CTR empty | No activity. Compass loaded the data and there was genuinely nothing to report. | Choose a longer time window, or ask your development team to check that Compass is set up on this site. |
| An error message | Compass couldn’t load the data. | This is not zero traffic. Refresh; if it continues, contact Arc XP Customer Support. Don’t record the period as having no activity. |
What’s next
- Getting Started with Compass
- Compass Analytics: Technical Reference on the developer portal